QUESTION IMAGE
Question
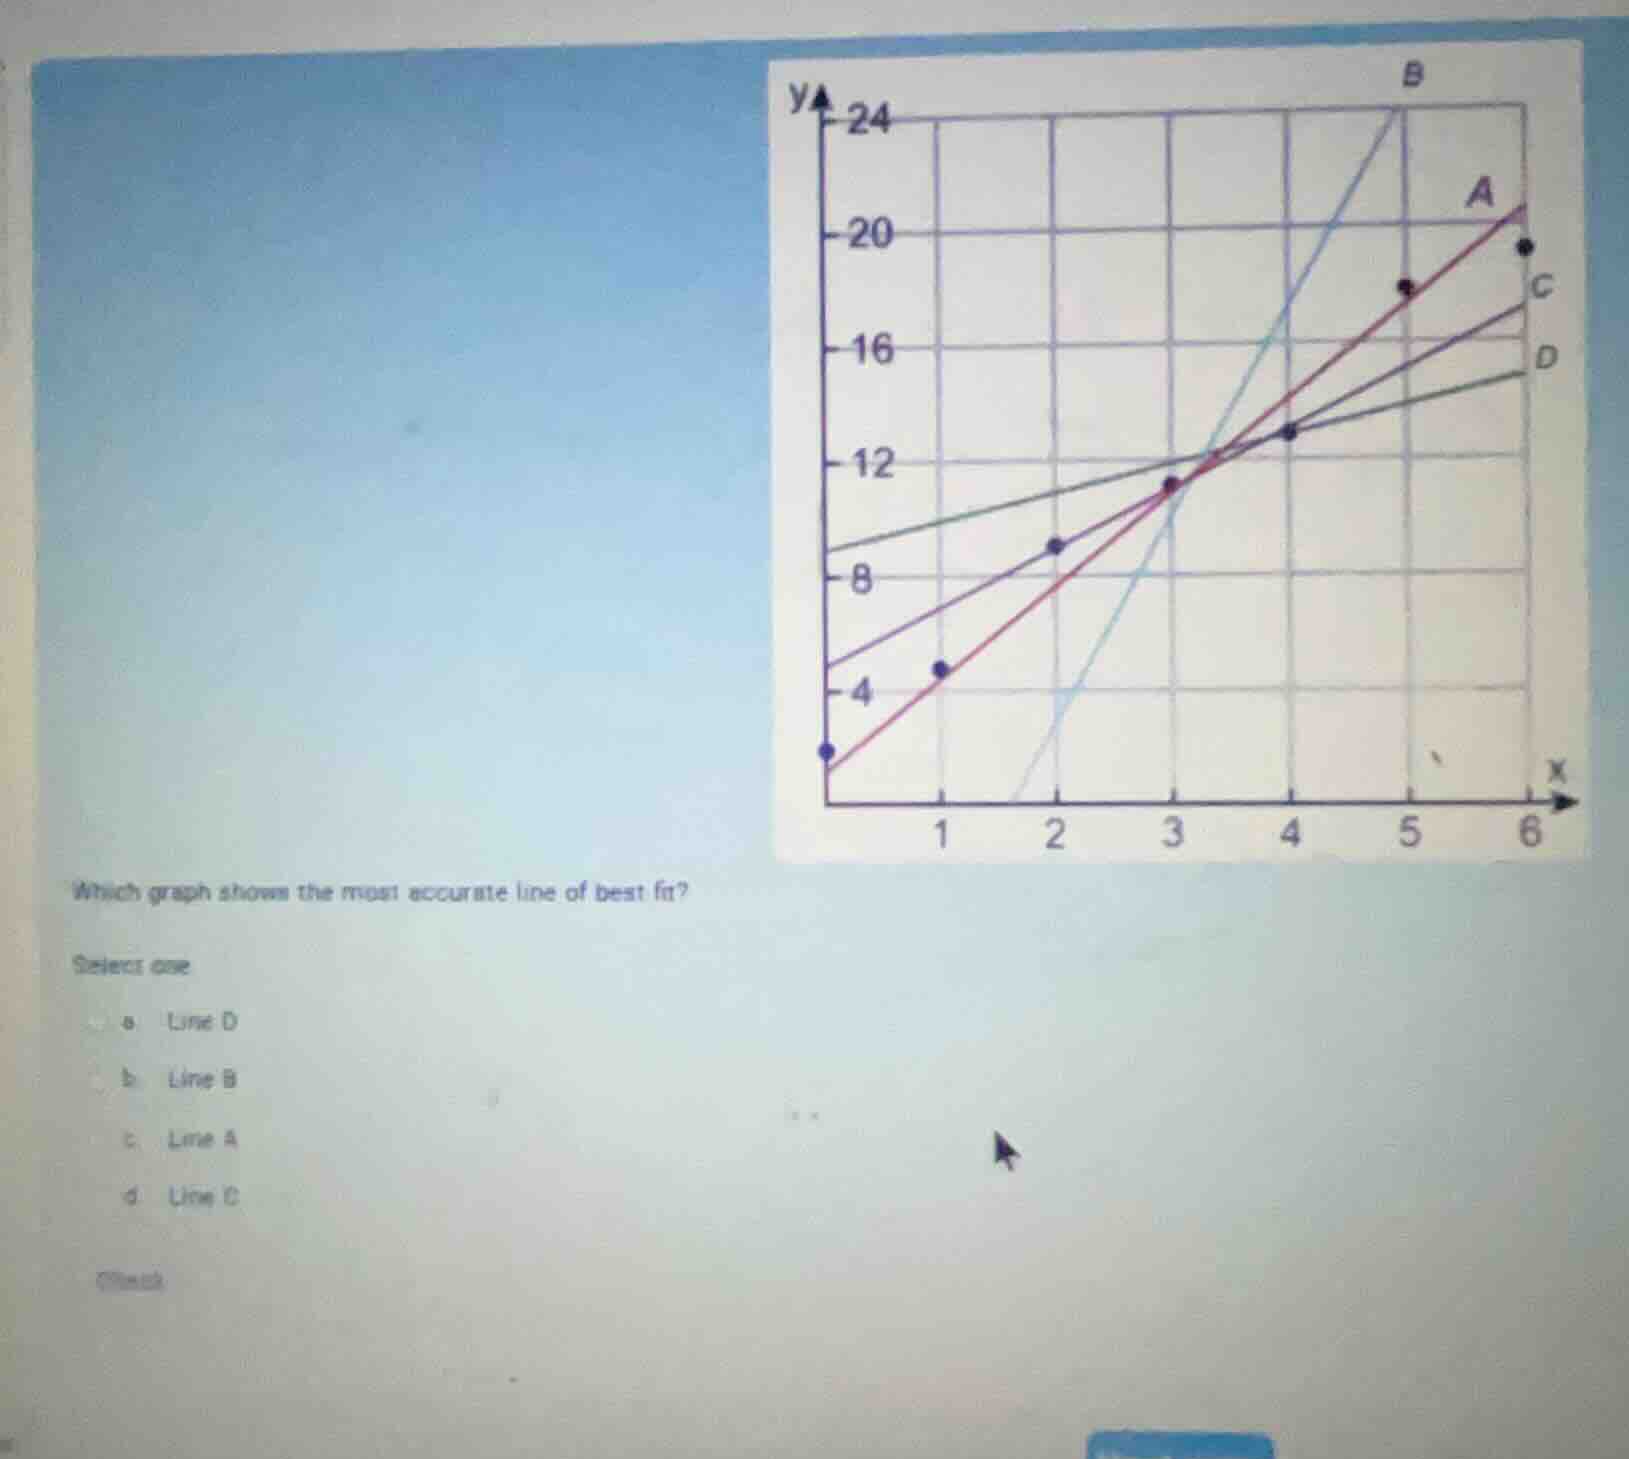
which graph shows the most accurate line of best fit?
select one:
a. line d
b. line b
c. line a
d. line c
Identify the coordinates of the data points
$$
(0, 2), (1, 4.5), (2, 9), (3, 11), (4, 13), (5, 18), (6, 19.5)
$$
Evaluate the alignment of each line with the data points
- Line B is too steep, passing far below the points at \(x < 3\) and far above at \(x > 3\).
- Line D is too flat, passing above the points at \(x < 3\) and below at \(x > 3\).
- Line C passes through \((3, 11)\) and \((4, 13)\) but lies above the points at \(x < 3\) and below the points at \(x > 3\).
- Line A passes directly through or very close to almost all points: \((0, 2)\), \((3, 11)\), \((4, 13)\), and \((5, 18)\), with the remaining points evenly balanced on both sides.
Determine the line of best fit
$$
\text{Line A represents the most accurate line of best fit.}
$$

Snap & solve any problem in the app
Get step-by-step solutions on Sovi AI
Photo-based solutions with guided steps
Explore more problems and detailed explanations
- a. Line D
- b. Line B
- c. Line A (Correct answer)
- d. Line C