QUESTION IMAGE
Question
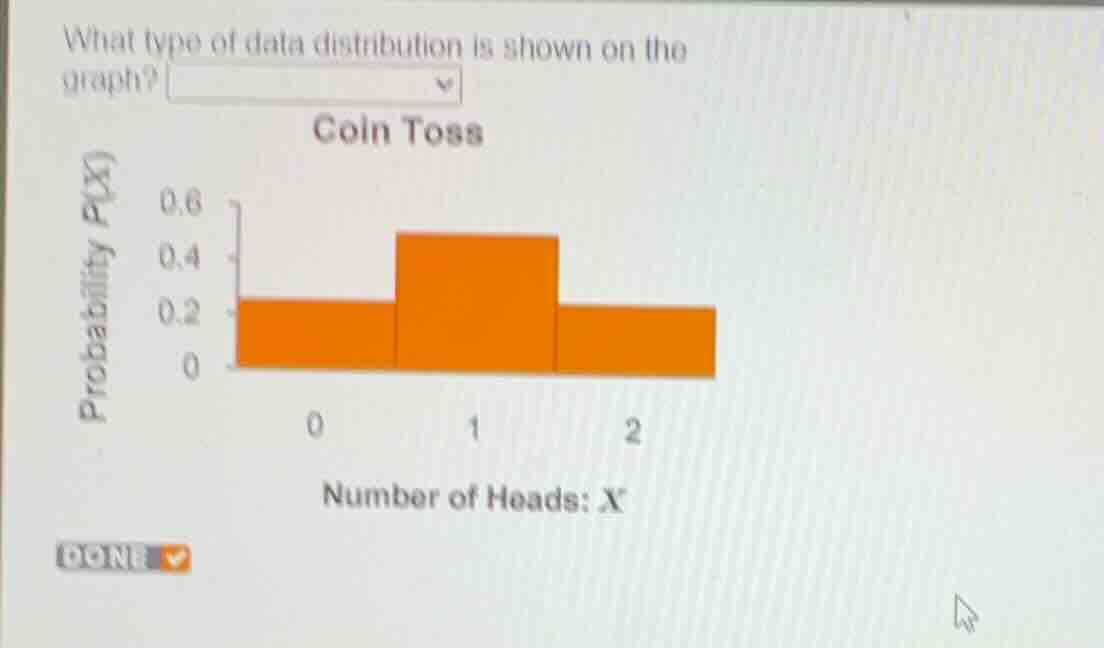
what type of data distribution is shown on the graph?
coin toss
probability p(x)
0.6
0.4
0.2
0
0 1 2
number of heads: x
Analyze the shape of the distribution
Using the Symmetric Distribution Properties knowledge point
The histogram displays the probability distribution of a coin toss experiment, specifically the number of heads \(X\) when tossing two coins.
- The probability of getting \(0\) heads is \(0.25\).
- The probability of getting \(1\) head is \(0.50\).
- The probability of getting \(2\) heads is \(0.25\).
The left side of the distribution (at \(X = 0\)) is a perfect mirror image of the right side (at \(X = 2\)) relative to the center peak (at \(X = 1\)). Therefore, the data distribution is symmetric.

Snap & solve any problem in the app
Get step-by-step solutions on Sovi AI
Photo-based solutions with guided steps
Explore more problems and detailed explanations
What type of data distribution is shown on the graph? <blank>symmetric</blank>