QUESTION IMAGE
Question
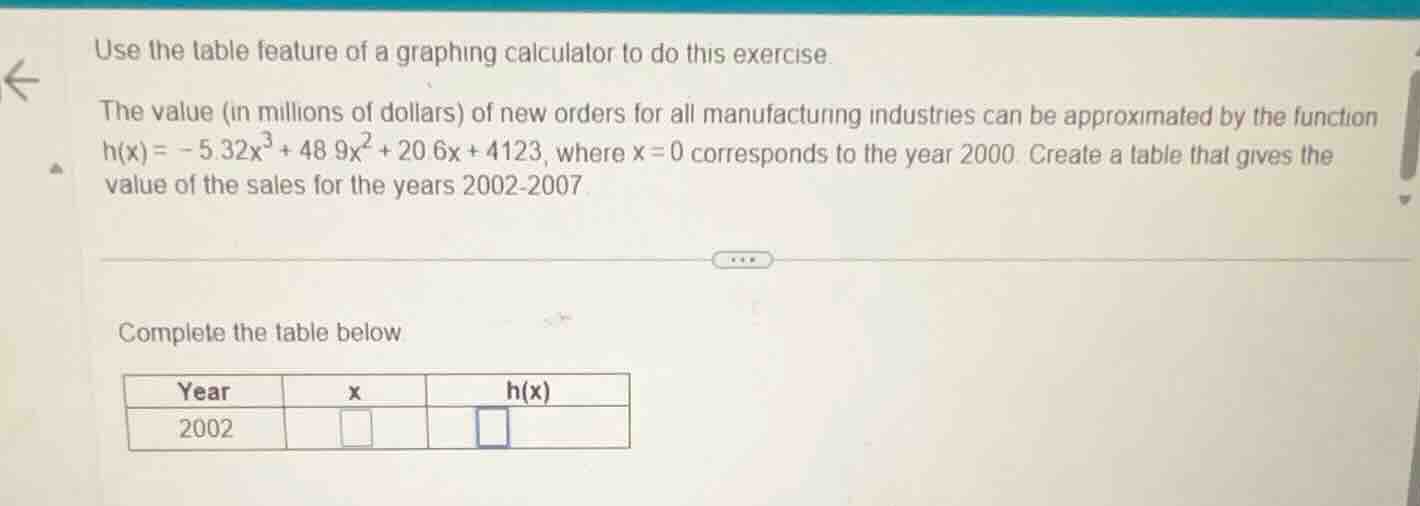
use the table feature of a graphing calculator to do this exercise. the value (in millions of dollars) of new orders for all manufacturing industries can be approximated by the function $h(x) = -5.32x^3 + 48.9x^2 + 20.6x + 4123$, where $x = 0$ corresponds to the year 2000. create a table that gives the value of the sales for the years 2002 - 2007. complete the table below | year | x | h(x) | | 2002 | □ | □ |
Step1: Determine x for 2002
Since \( x = 0 \) corresponds to 2000, for 2002, \( x=2002 - 2000=2 \).
Step2: Substitute x = 2 into h(x)
The function is \( h(x)=- 5.32x^{3}+48.9x^{2}+20.6x + 4123 \).
Substitute \( x = 2 \):
For the years 2003 - 2007:
- 2003: \( x = 3 \)
- 2004: \( x = 4 \)
- 2005: \( x = 5 \)
- 2006: \( x = 6 \)
- 2007: \( x = 7 \)

Snap & solve any problem in the app
Get step-by-step solutions on Sovi AI
Photo-based solutions with guided steps
Explore more problems and detailed explanations
| Year | x | h(x) (in millions of dollars) |
|---|---|---|
| 2003 | 3 | 4481.26 |
| 2004 | 4 | 4647.32 |
| 2005 | 5 | 4783.5 |
| 2006 | 6 | 4857.88 |
| 2007 | 7 | 4838.54 |
For the 2002 row specifically:
- x: 2
- h(x): 4317.24