QUESTION IMAGE
Question
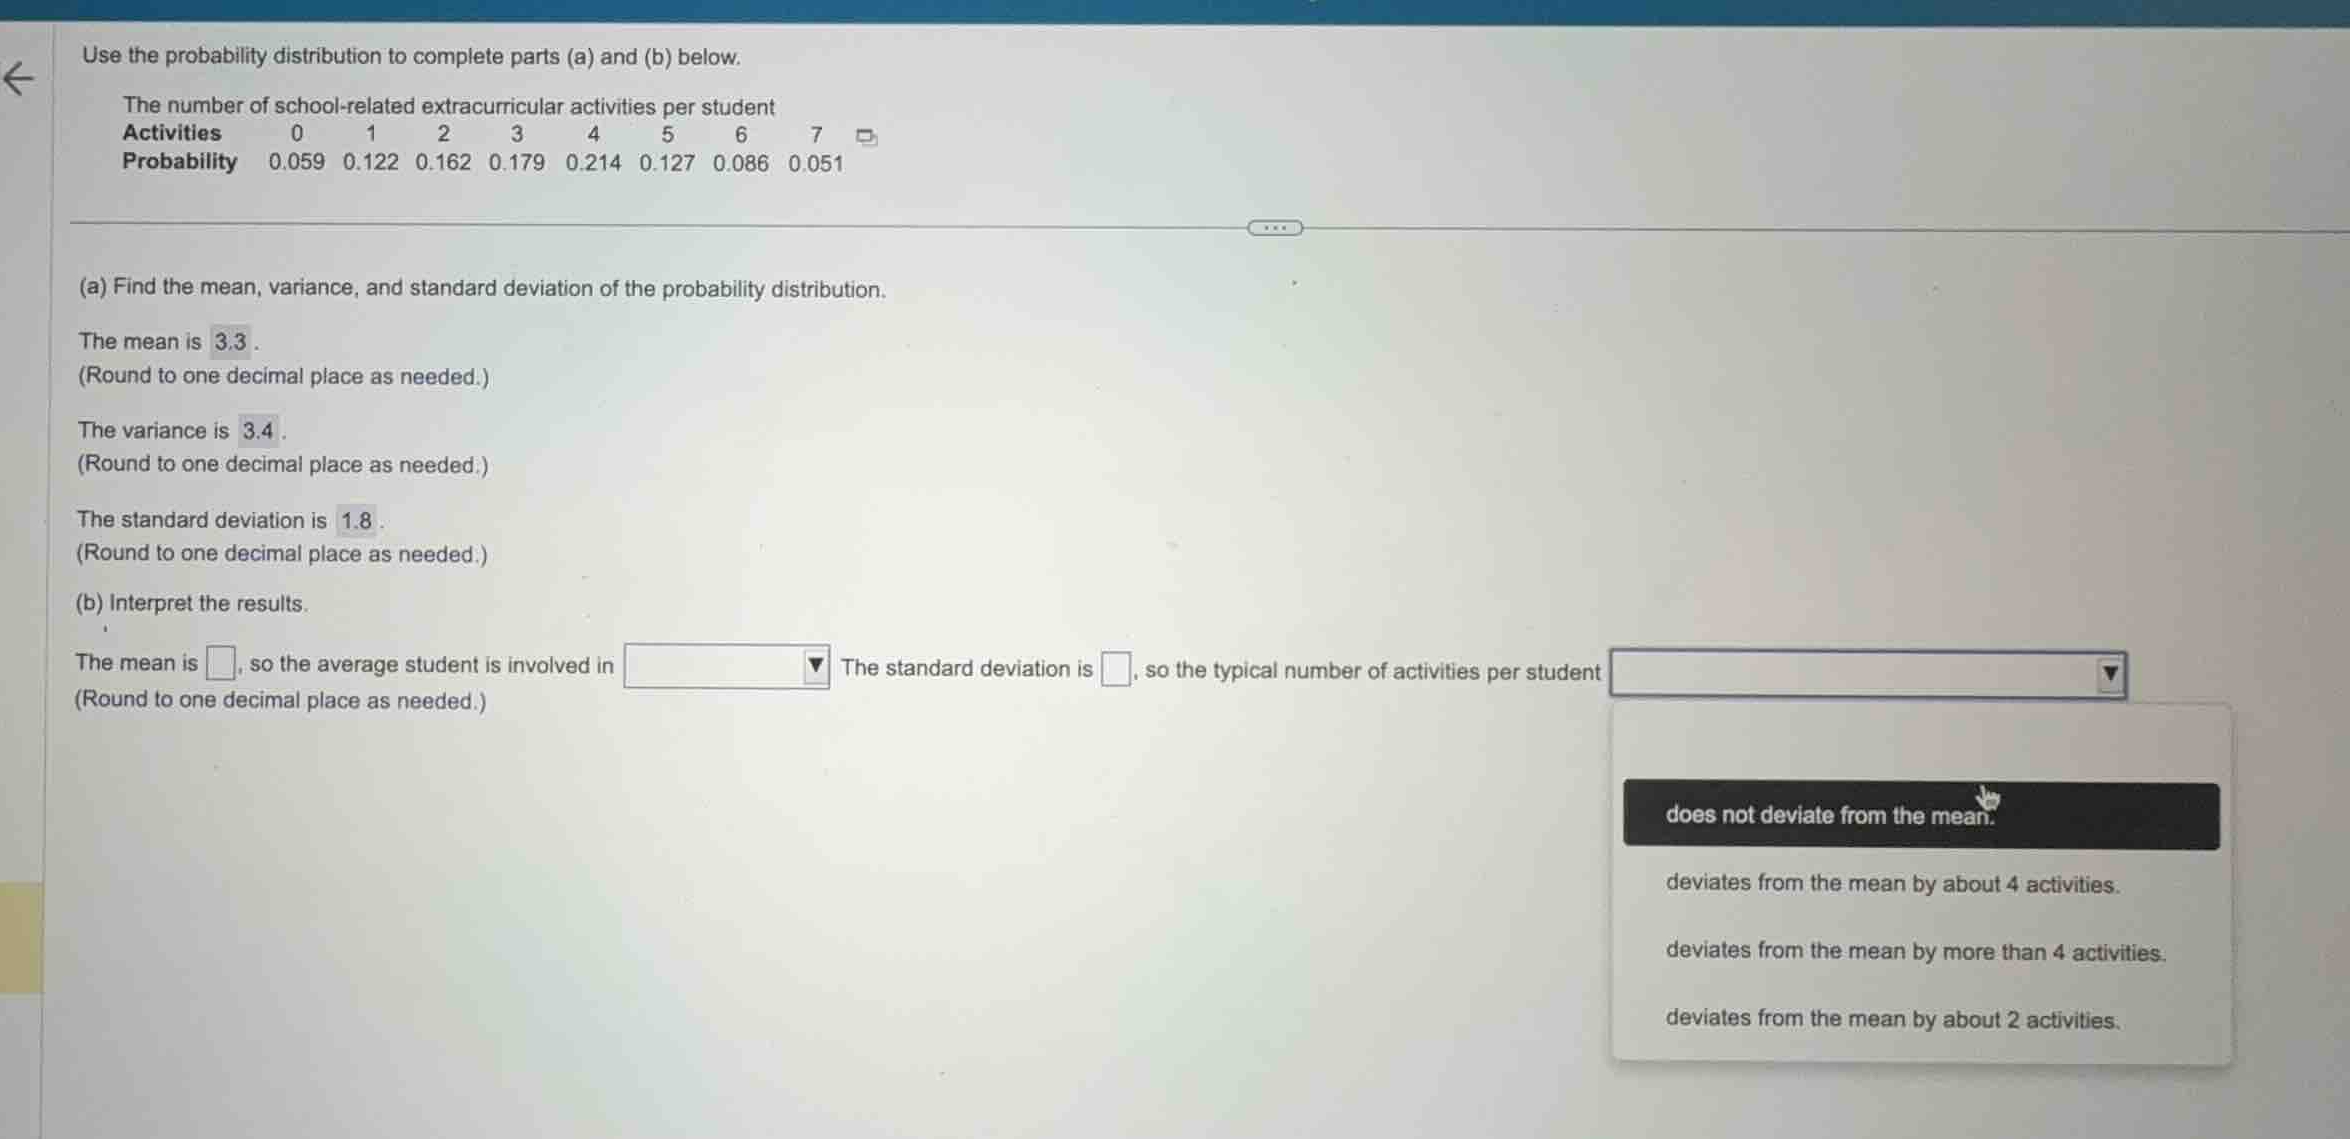
use the probability distribution to complete parts (a) and (b) below.
the number of school-related extracurricular activities per student
activities: 0, 1, 2, 3, 4, 5, 6, 7
probability: 0.059, 0.122, 0.162, 0.179, 0.214, 0.127, 0.086, 0.051
(a) find the mean, variance, and standard deviation of the probability distribution.
the mean is 3.3.
(round to one decimal place as needed.)
the variance is 3.4.
(round to one decimal place as needed.)
the standard deviation is 1.8.
(round to one decimal place as needed.)
(b) interpret the results.
the mean is , so the average student is involved in activities. the standard deviation is , so the typical number of activities per student .
(round to one decimal place as needed.)
dropdown options:
does not deviate from the mean.
deviates from the mean by about 4 activities.
deviates from the mean by more than 4 activities.
deviates from the mean by about 2 activities.
Calculate the mean of the probability distribution
Calculate the variance and standard deviation
Interpret the results
- The mean is \(3.3\), so the average student is involved in about 3 activities.
- The standard deviation is \(1.8\), so the typical number of activities per student deviates from the mean by about 2 activities (rounding 1.8 to the nearest whole number, which is 2).

Snap & solve any problem in the app
Get step-by-step solutions on Sovi AI
Photo-based solutions with guided steps
Explore more problems and detailed explanations
The mean is <blank>3.3</blank>, so the average student is involved in <blank>about 3 activities</blank>. The standard deviation is <blank>1.8</blank>, so the typical number of activities per student <blank>deviates from the mean by about 2 activities.</blank>