QUESTION IMAGE
Question
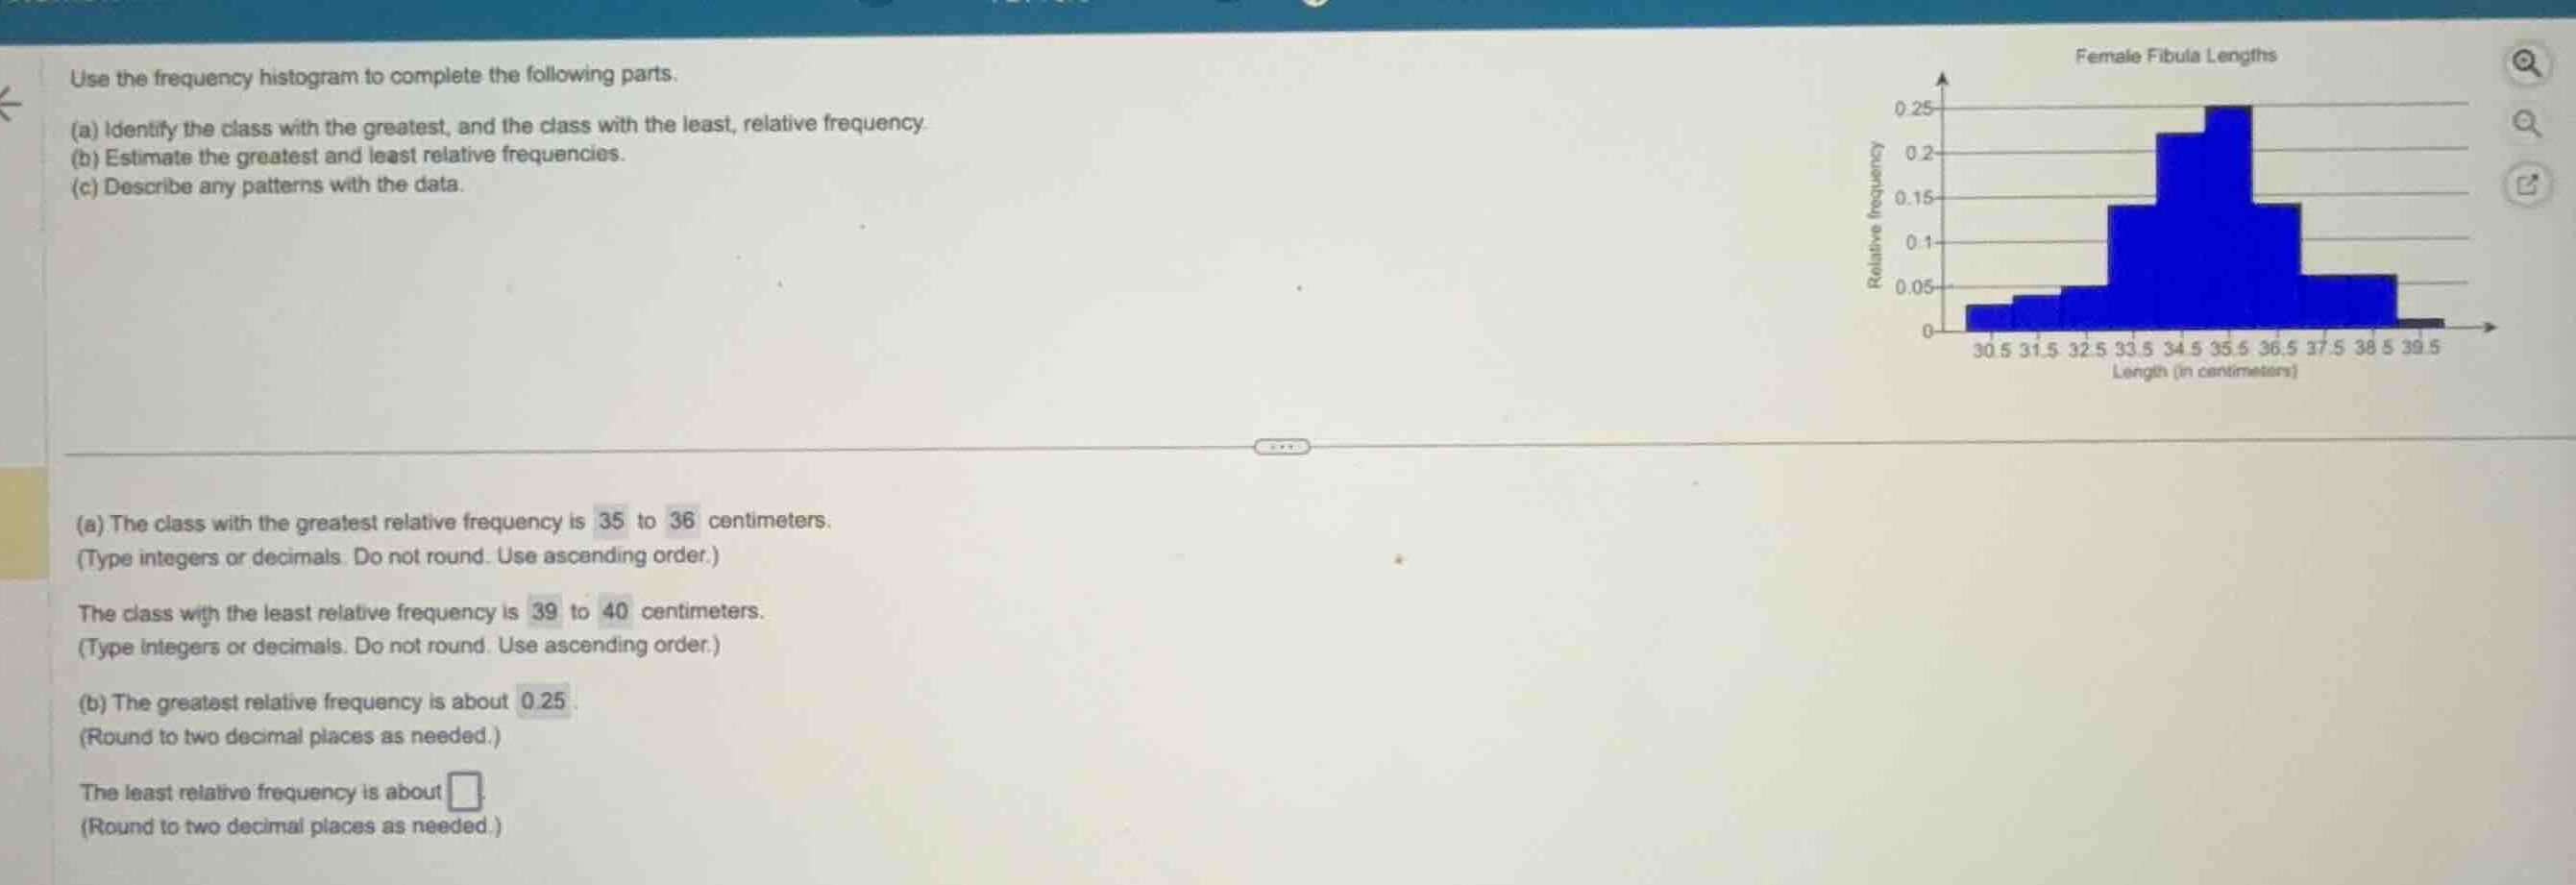
use the frequency histogram to complete the following parts.
(a) identify the class with the greatest, and the class with the least, relative frequency.
(b) estimate the greatest and least relative frequencies.
(c) describe any patterns with the data.
(a) the class with the greatest relative frequency is 35 to 36 centimeters.
(type integers or decimals. do not round. use ascending order.)
the class with the least relative frequency is 39 to 40 centimeters.
(type integers or decimals. do not round. use ascending order.)
(b) the greatest relative frequency is about 0.25.
(round to two decimal places as needed.)
the least relative frequency is about
(round to two decimal places as needed.)
Identify the least relative frequency class
Using the Histogram Interpretation knowledge point
Read the height of the least relative frequency bar
Using the Relative Frequency Histogram knowledge point

Snap & solve any problem in the app
Get step-by-step solutions on Sovi AI
Photo-based solutions with guided steps
Explore more problems and detailed explanations
The least relative frequency is about <blank>0.01</blank>