QUESTION IMAGE
Question
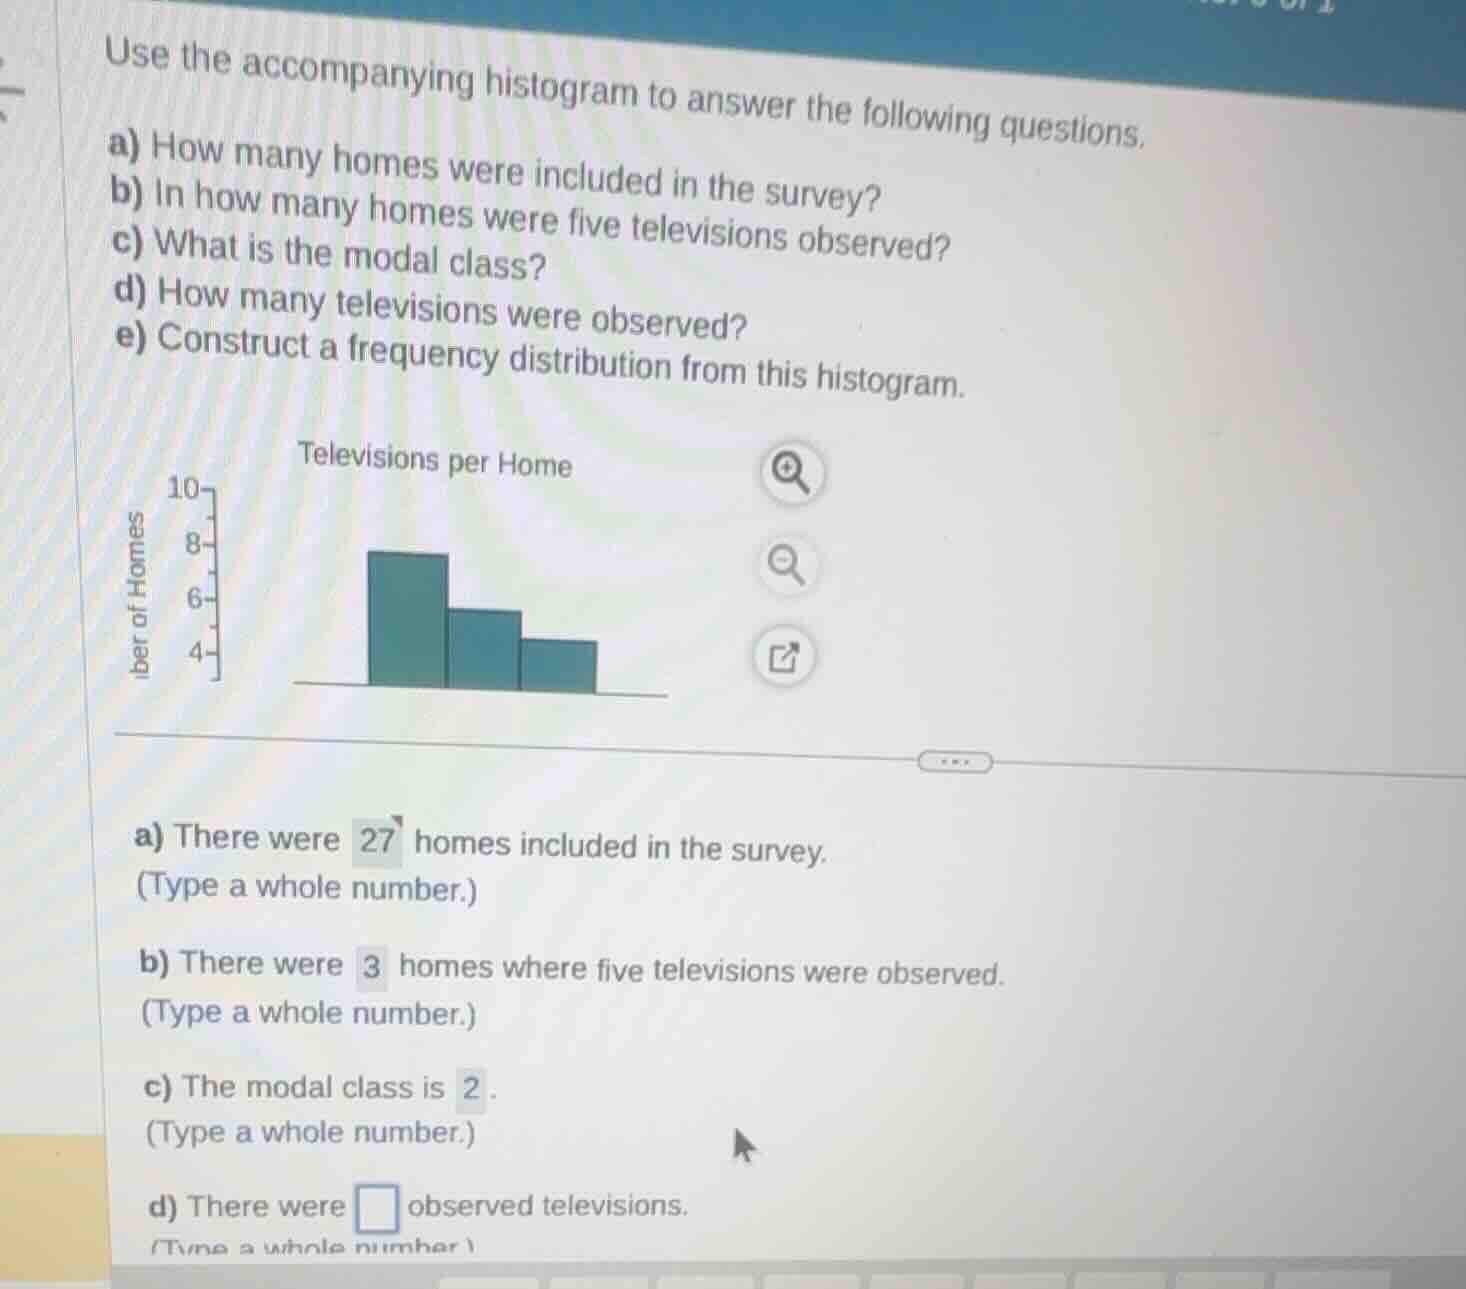
use the accompanying histogram to answer the following questions.
a) how many homes were included in the survey?
b) in how many homes were five televisions observed?
c) what is the modal class?
d) how many televisions were observed?
e) construct a frequency distribution from this histogram.
a) there were 27 homes included in the survey.
(type a whole number.)
b) there were 3 homes where five televisions were observed.
(type a whole number.)
c) the modal class is 2.
(type a whole number.)
d) there were observed televisions.
(type a whole number.)
Read frequencies from the histogram
Calculate total televisions observed
Construct the frequency distribution table

Snap & solve any problem in the app
Get step-by-step solutions on Sovi AI
Photo-based solutions with guided steps
Explore more problems and detailed explanations
Question a
There were 24 homes included in the survey.
Question b
There were 3 homes where five televisions were observed.
Question c
The modal class is 2.
Question d
There were 76 observed televisions.
Question e
The frequency distribution is:
| Televisions | Frequency |
|---|---|
| 2 | 8 |
| 3 | 6 |
| 4 | 5 |
| 5 | 3 |
| 6 | 1 |