QUESTION IMAGE
Question
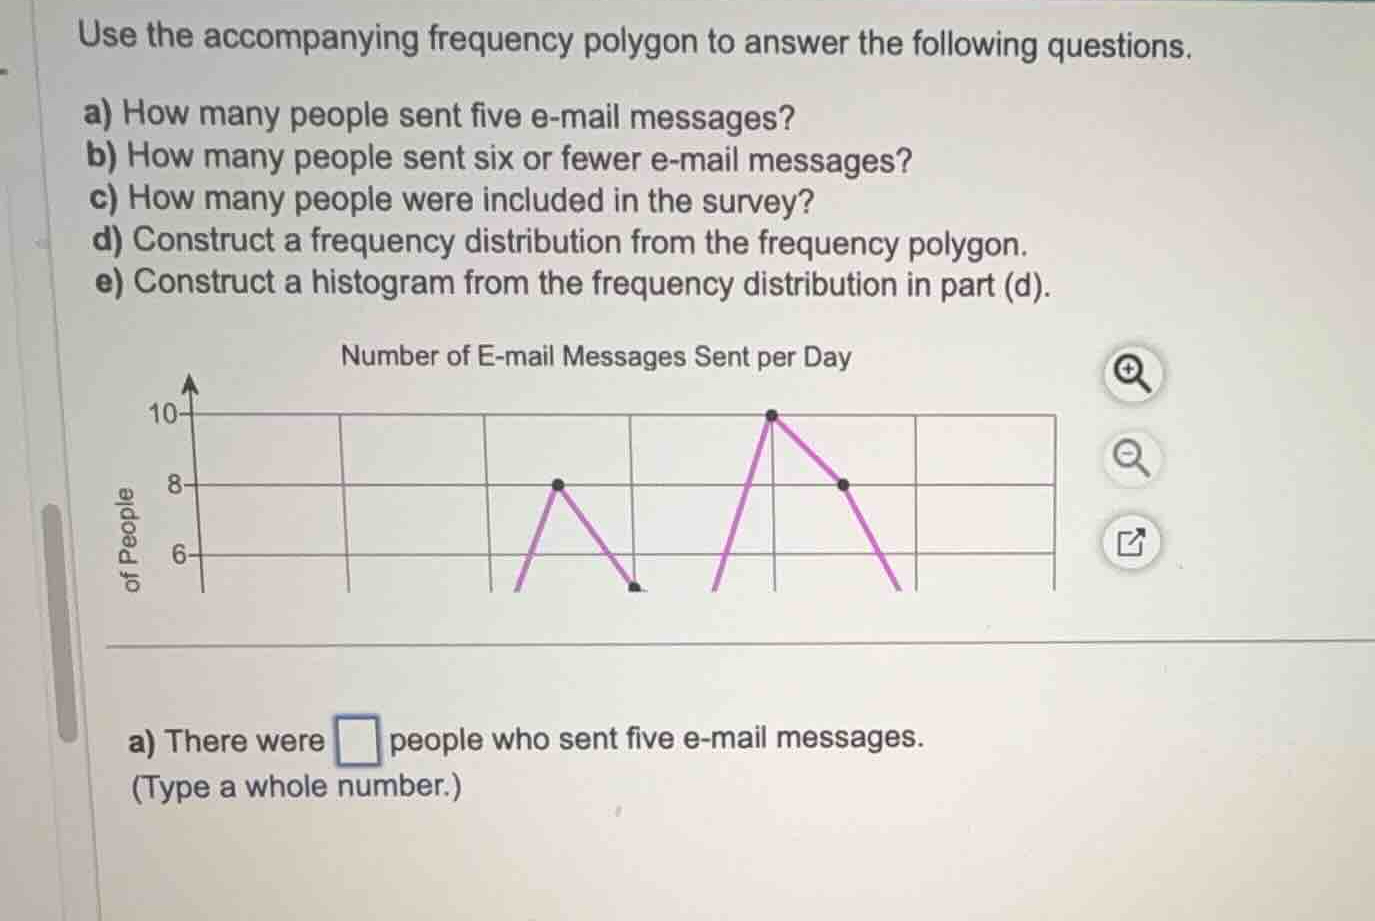
use the accompanying frequency polygon to answer the following questions.
a) how many people sent five e-mail messages?
b) how many people sent six or fewer e-mail messages?
c) how many people were included in the survey?
d) construct a frequency distribution from the frequency polygon.
e) construct a histogram from the frequency distribution in part (d).
a) there were people who sent five e-mail messages.
(type a whole number.)
Identify the data point for five e-mail messages
Observe the frequency polygon where the horizontal axis represents the number of e-mail messages sent per day and the vertical axis represents the number of people (frequency).
The grid lines on the horizontal axis correspond to consecutive integers. Looking at the plotted points from left to right:
- The first peak is at horizontal coordinate \(4\) with a height of \(8\).
- The next point is at horizontal coordinate \(5\) with a height of \(5\).
- The next point is at horizontal coordinate \(6\) with a height of \(5\).
- The highest peak is at horizontal coordinate \(7\) with a height of \(10\).
- The next point is at horizontal coordinate \(8\) with a height of \(8\).
- The next point is at horizontal coordinate \(9\) with a height of \(5\).
Thus, at \(x = 5\) (five e-mail messages), the vertical coordinate (number of people) is \(5\).

Snap & solve any problem in the app
Get step-by-step solutions on Sovi AI
Photo-based solutions with guided steps
Explore more problems and detailed explanations
a) There were <blank>5</blank> people who sent five e-mail messages.