QUESTION IMAGE
Question
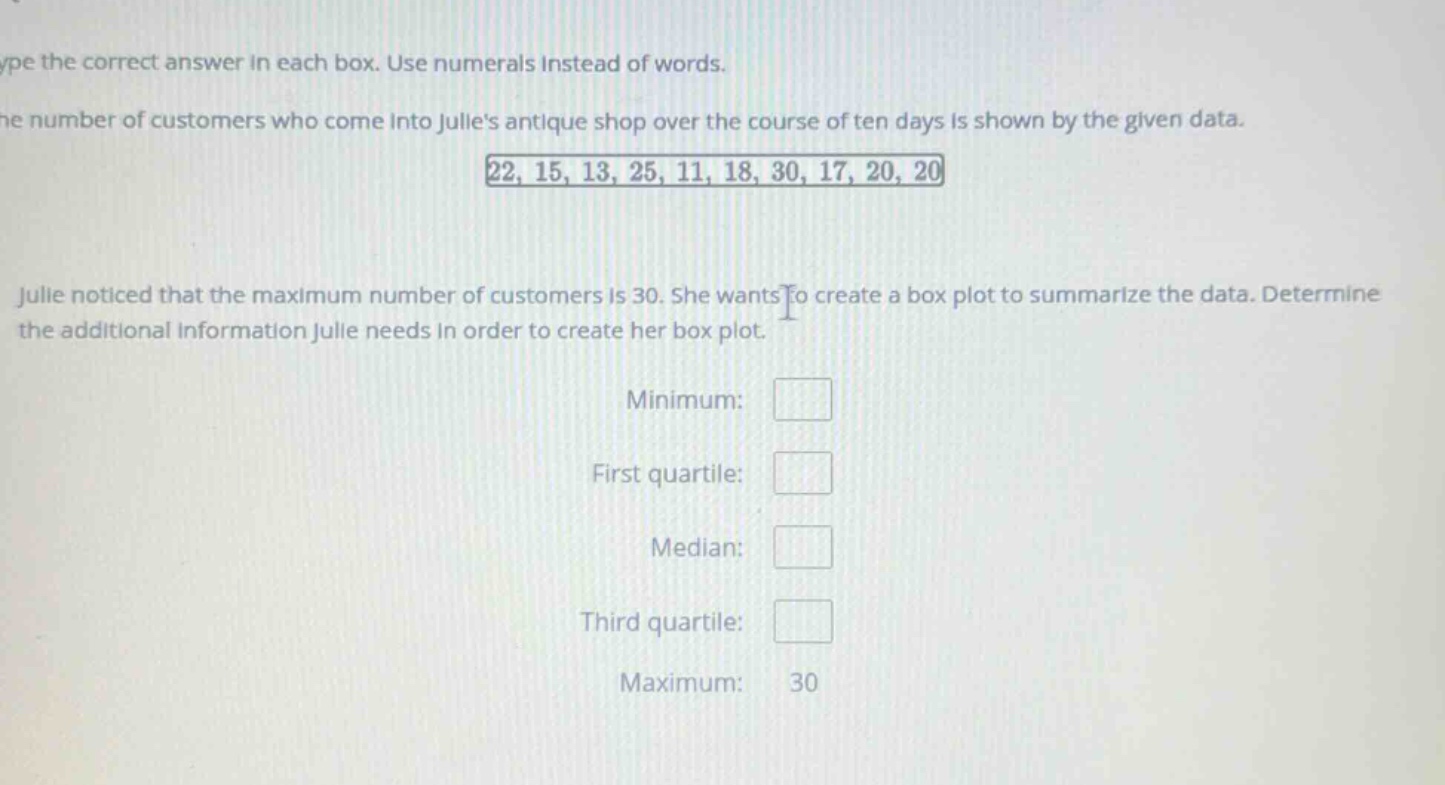
type the correct answer in each box. use numerals instead of words.
the number of customers who come into julies antique shop over the course of ten days is shown by the given data.
\\22, 15, 13, 25, 11, 18, 30, 17, 20, 20\\
julie noticed that the maximum number of customers is 30. she wants to create a box plot to summarize the data. determine the additional information julie needs in order to create her box plot.
minimum:
first quartile:
median:
third quartile:
maximum: 30
🆕 New Concept Discovered: Box Plots and the Five-Number Summary
Dividing data into four equal-sized quarters
Step 1: Order the data
To find the five-number summary, we first arrange the data set of \(10\) values in ascending order:
- Minimum: The smallest value in the ordered list is \(11\).
Step 2: Find the Median
The median is the middle value of the data set. Since there is an even number of values (\(10\) values), the median is the average of the two middle values (the \(5^{\text{th}}\) and \(6^{\text{th}}\) values):
This splits our data into two halves:
- Lower half: \(11, 13, 15, 17, 18\)
- Upper half: \(20, 20, 22, 25, 30\)
Step 3: Find the First Quartile (Q1) and Third Quartile (Q3)
- First Quartile (\(Q_1\)): The median of the lower half of the data. The middle value of \(11, 13, \mathbf{15}, 17, 18\) is \(15\).
- Third Quartile (\(Q_3\)): The median of the upper half of the data. The middle value of \(20, 20, \mathbf{22}, 25, 30\) is \(22\).

Snap & solve any problem in the app
Get step-by-step solutions on Sovi AI
Photo-based solutions with guided steps
Explore more problems and detailed explanations
- Minimum: 11
- First quartile: 15
- Median: 19
- Third quartile: 22
- Maximum: 30