QUESTION IMAGE
Question
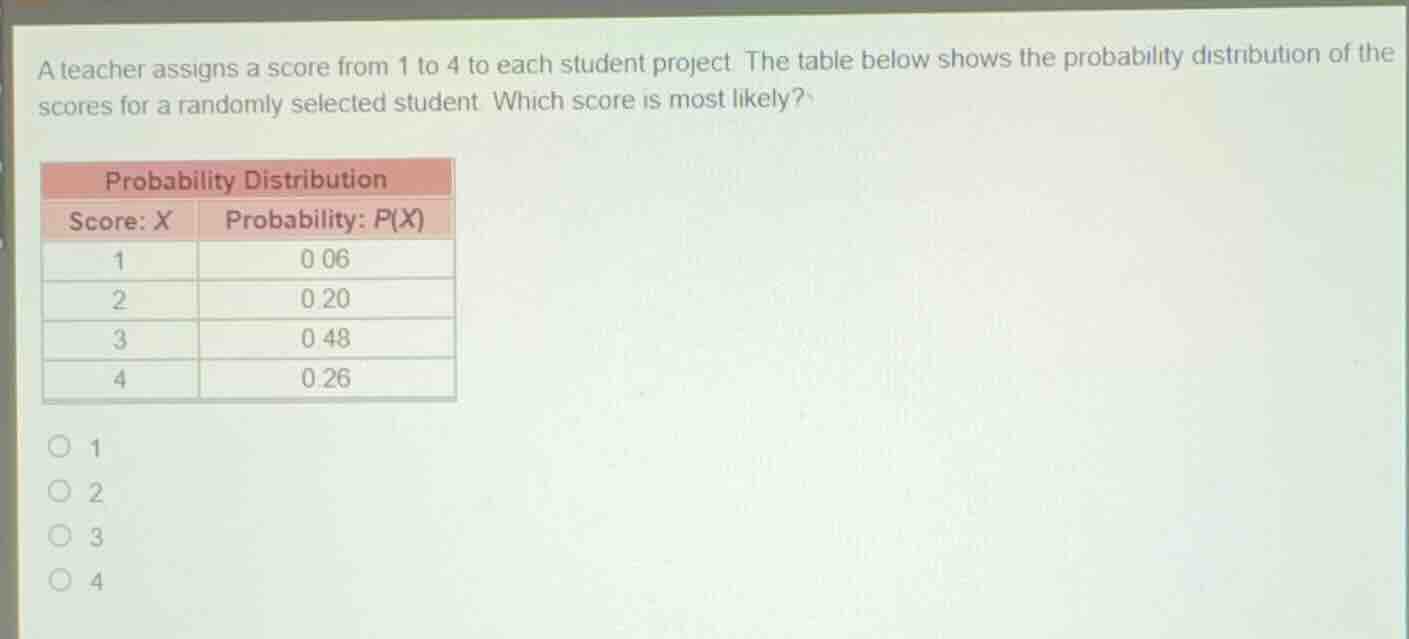
a teacher assigns a score from 1 to 4 to each student project. the table below shows the probability distribution of the scores for a randomly selected student. which score is most likely?
probability distribution
score: x | probability: p(x)
1 | 0.06
2 | 0.20
3 | 0.48
4 | 0.26
1
2
3
4
Identify the probabilities for each score
The table lists the probability \(P(X)\) for each score \(X\):
- For \(X = 1\), \(P(1) = 0.06\)
- For \(X = 2\), \(P(2) = 0.20\)
- For \(X = 3\), \(P(3) = 0.48\)
- For \(X = 4\), \(P(4) = 0.26\)
Compare the probabilities to find the maximum
Comparing the values:
$$
0.48 > 0.26 > 0.20 > 0.06
$$
The highest probability is \(0.48\), which corresponds to a score of \(3\).
Determine the most likely score
Since a score of \(3\) has the highest probability, it is the most likely score.

Snap & solve any problem in the app
Get step-by-step solutions on Sovi AI
Photo-based solutions with guided steps
Explore more problems and detailed explanations
- 1
- 2
- 3 (Correct answer)
- 4