QUESTION IMAGE
Question
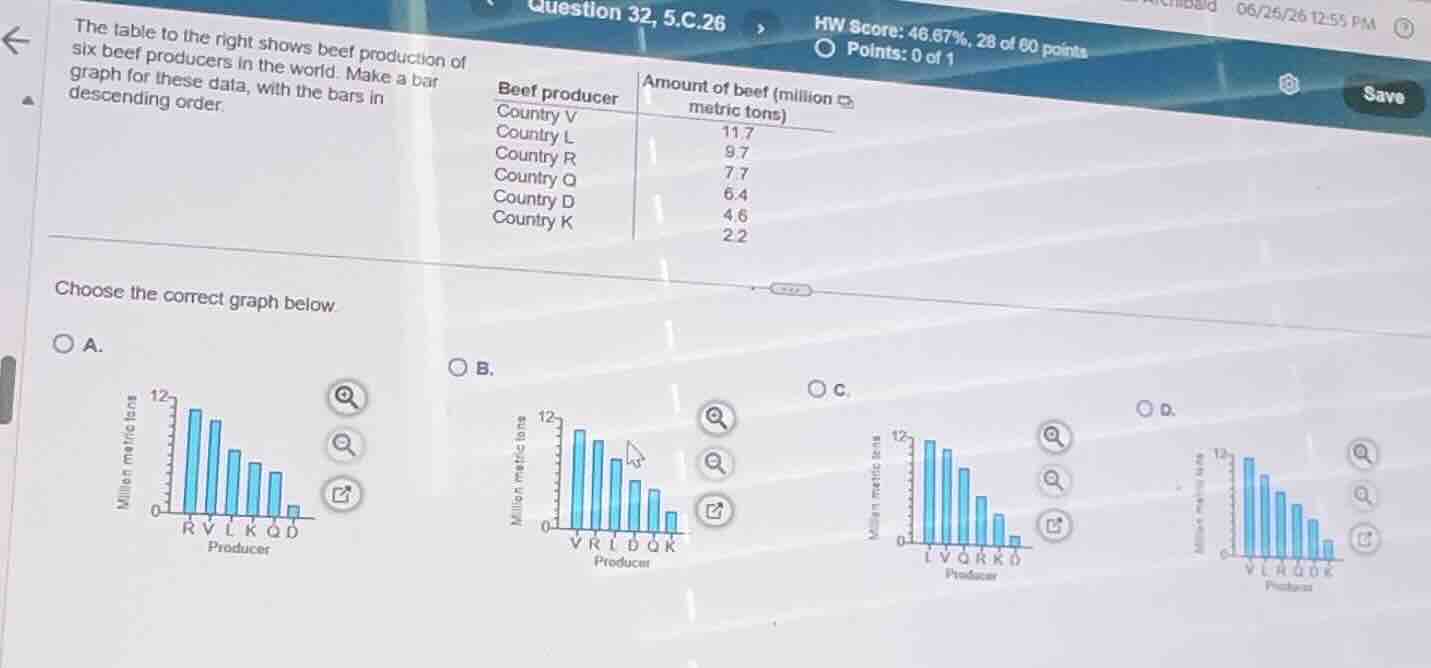
the table to the right shows beef production of six beef producers in the world. make a bar graph for these data, with the bars in descending order.
\
choose the correct graph below.
Identify the given data and requirements
Using the Graph Interpretation knowledge point
The table lists beef production (in million metric tons) for six producers:
- Country V: \(11.7\)
- Country L: \(9.7\)
- Country R: \(7.7\)
- Country Q: \(6.4\)
- Country D: \(4.6\)
- Country K: \(2.2\)
The problem requires a bar graph with the bars arranged in descending order of production.
Determine the correct order of producers
Using the Graph Interpretation knowledge point
Comparing the values:
This corresponds to the following sequence of countries:
Match with the given options
We examine the horizontal axis labels of each option to find the sequence \(\text{V, L, R, Q, D, K}\):
- Option A: Labels are \(\text{R, V, L, K, Q, D}\) (Incorrect order)
- Option B: Labels are \(\text{V, R, L, D, Q, K}\) (Incorrect order)
- Option C: Labels are \(\text{L, V, Q, R, K, D}\) (Incorrect order)
- Option D: Labels are \(\text{V, L, R, Q, D, K}\) (Correct descending order)

Snap & solve any problem in the app
Get step-by-step solutions on Sovi AI
Photo-based solutions with guided steps
Explore more problems and detailed explanations
- (A) Bar graph with labels R, V, L, K, Q, D
- (B) Bar graph with labels V, R, L, D, Q, K
- (C) Bar graph with labels L, V, Q, R, K, D
- (D) Bar graph with labels V, L, R, Q, D, K (Correct answer)