QUESTION IMAGE
Question
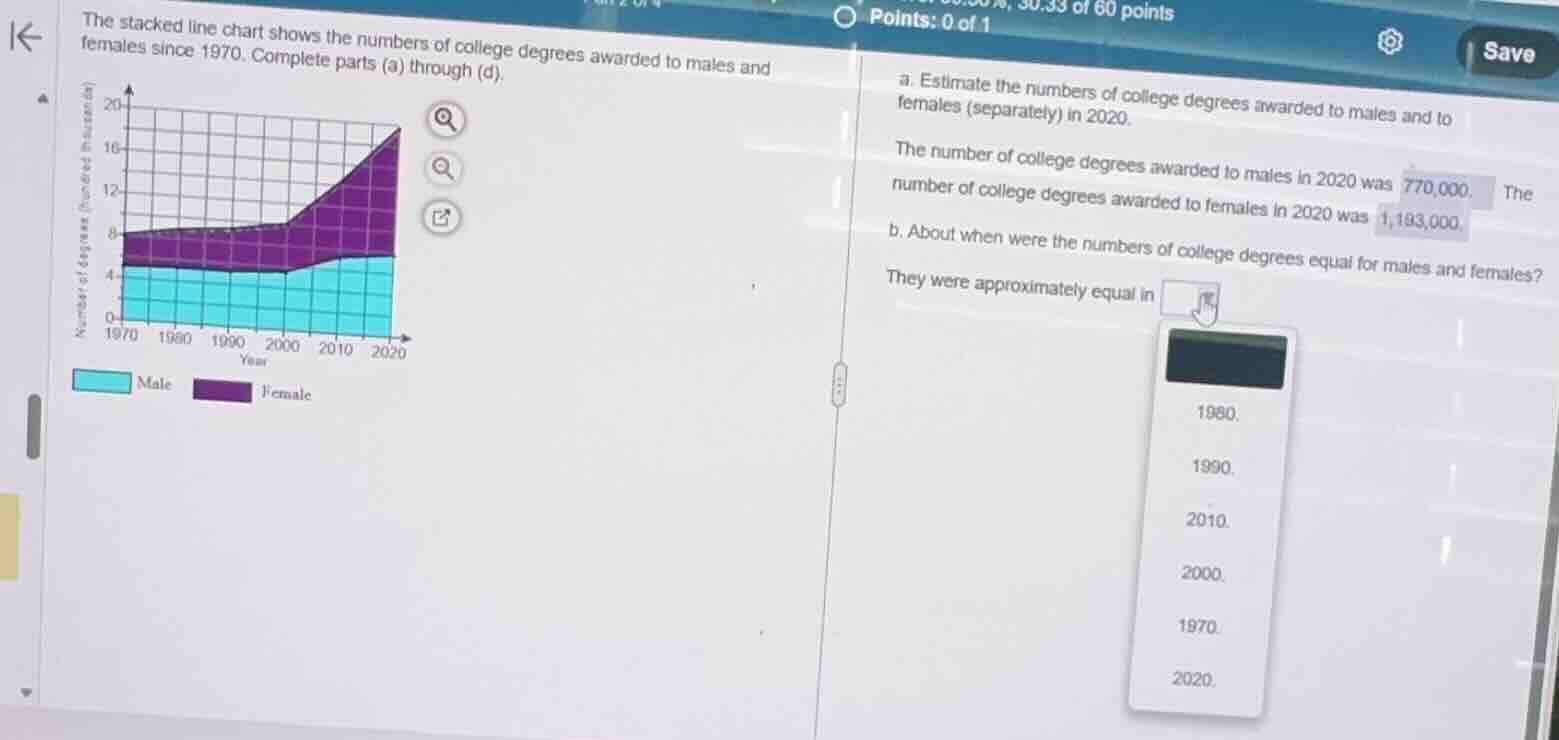
the stacked line chart shows the numbers of college degrees awarded to males and females since 1970. complete parts (a) through (d).
a. estimate the numbers of college degrees awarded to males and to females (separately) in 2020.
the number of college degrees awarded to males in 2020 was 770,000. the number of college degrees awarded to females in 2020 was 1,193,000.
b. about when were the numbers of college degrees equal for males and females?
they were approximately equal in
1980.
1990.
2010.
2000.
1970.
2020.
Identify the chart type
Using the Stacked Line Chart Interpretation and Stacked Chart Reading knowledge points
- The graph is a stacked line chart.
- The bottom region (cyan) represents the number of degrees awarded to males.
- The top region (purple) is stacked on top of the male region, representing degrees awarded to females.
- The vertical height of each individual region represents the value for that category.
Determine equal values condition
Using the Stacked Line Chart Interpretation and Stacked Chart Reading knowledge points
- For the two categories to be equal, the height of the male region must equal the height of the female region.
- Let \(M(t)\) be the height of the male region (from \(y = 0\) to the first line).
- Let \(F(t)\) be the height of the female region (from the first line to the top line).
- We look for the year \(t\) where \(M(t) = F(t)\), which means the first line is exactly halfway to the top line:
Analyze the graph by year
Using the Stacked Line Chart Interpretation and Stacked Chart Reading knowledge points
- 1970: Male line is at approximately \(5\) (hundred thousand). The top line is at approximately \(8\).
- \(M \approx 5\), \(F \approx 8 - 5 = 3\). Not equal.
- 1980: Male line is at approximately \(4.8\). The top line is at approximately \(8.5\).
- \(M \approx 4.8\), \(F \approx 8.5 - 4.8 = 3.7\). Not equal.
- 1990: Male line is at approximately \(4.5\). The top line is at approximately \(9\).
- \(M \approx 4.5\), \(F \approx 9 - 4.5 = 4.5\).
- Here, \(M = F = 4.5\) (hundred thousand).
Select the matching option
Using the Stacked Line Chart Interpretation and Stacked Chart Reading knowledge points
- The heights of the two regions are approximately equal in the year 1990.
- This corresponds to the option "1990."

Snap & solve any problem in the app
Get step-by-step solutions on Sovi AI
Photo-based solutions with guided steps
Explore more problems and detailed explanations
- 1980.
- 1990. (Correct answer)
- 2010.
- 2000.
- 1970.
- 2020.