QUESTION IMAGE
Question
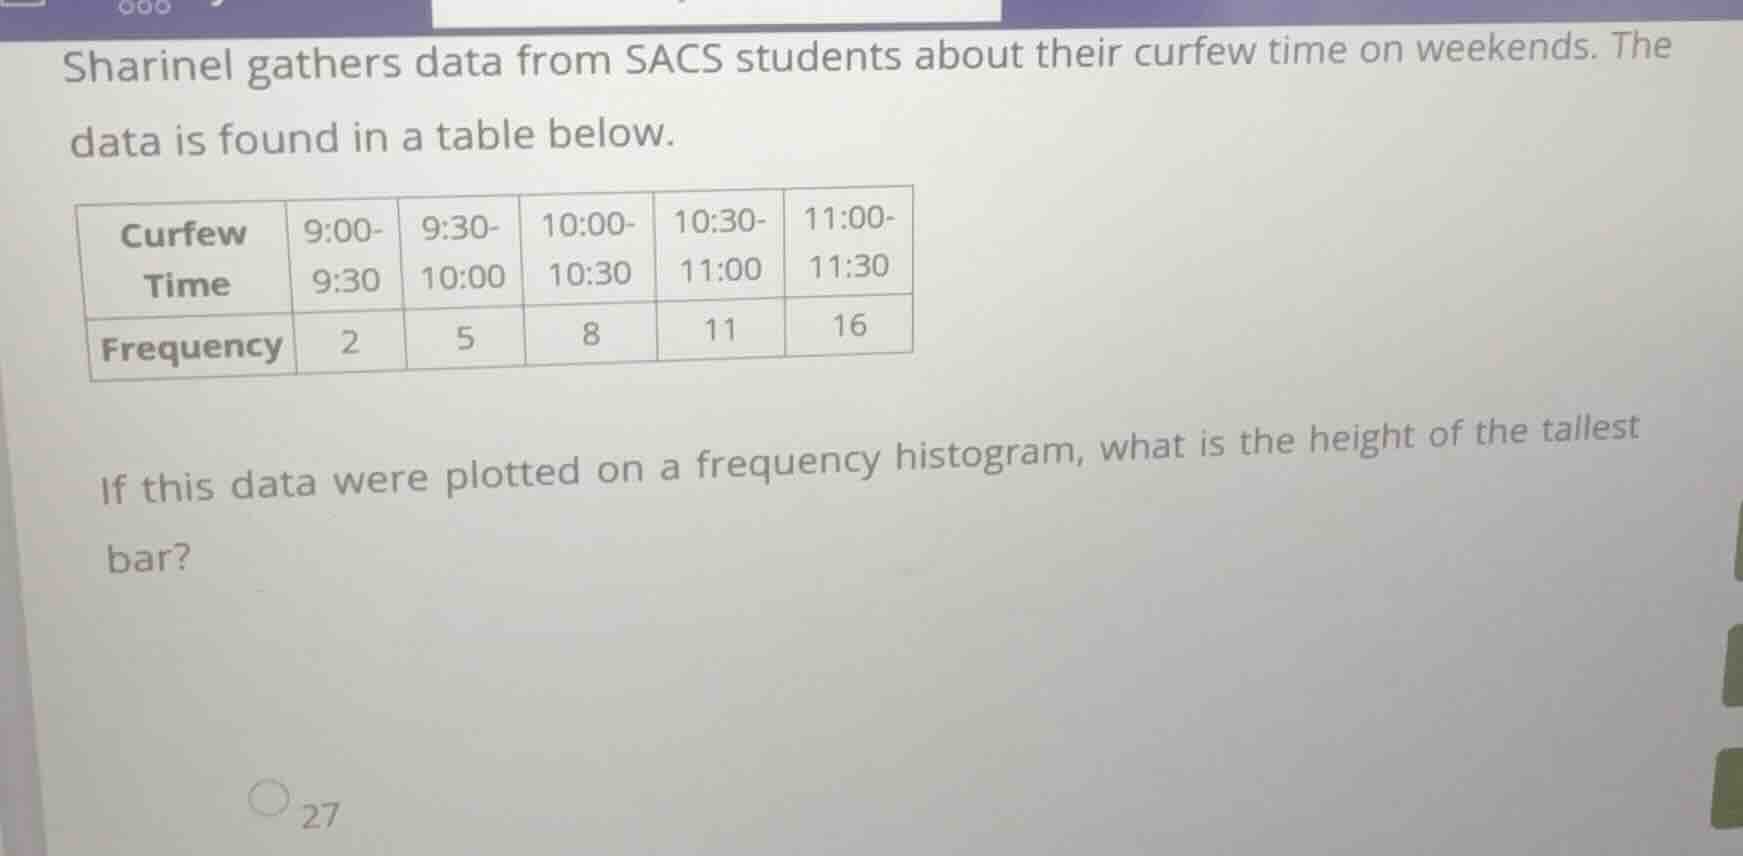
sharinel gathers data from sacs students about their curfew time on weekends. the data is found in a table below.
\
$$\begin{tabular}{|c|c|c|c|c|c|}
\\hline
curfew time & 9:00-9:30 & 9:30-10:00 & 10:00-10:30 & 10:30-11:00 & 11:00-11:30 \\\\
\\hline
frequency & 2 & 5 & 8 & 11 & 16 \\\\
\\hline
\\end{tabular}$$
if this data were plotted on a frequency histogram, what is the height of the tallest bar?
Identify the given data
Using the Data Extraction knowledge point
The frequency table lists the following intervals and their corresponding frequencies:
- \(9:00\text{–}9:30\): \(2\)
- \(9:30\text{–}10:00\): \(5\)
- \(10:00\text{–}10:30\): \(8\)
- \(10:30\text{–}11:00\): \(11\)
- \(11:00\text{–}11:30\): \(16\)
Determine the tallest bar height
Using the Histogram Interpretation knowledge point
In a frequency histogram, the height of each bar represents the frequency of that interval. The tallest bar corresponds to the interval with the highest frequency:
$$
\text{Maximum Frequency} = \max(2, 5, 8, 11, 16) = 16
$$

Snap & solve any problem in the app
Get step-by-step solutions on Sovi AI
Photo-based solutions with guided steps
Explore more problems and detailed explanations
16