QUESTION IMAGE
Question
select the correct answer.
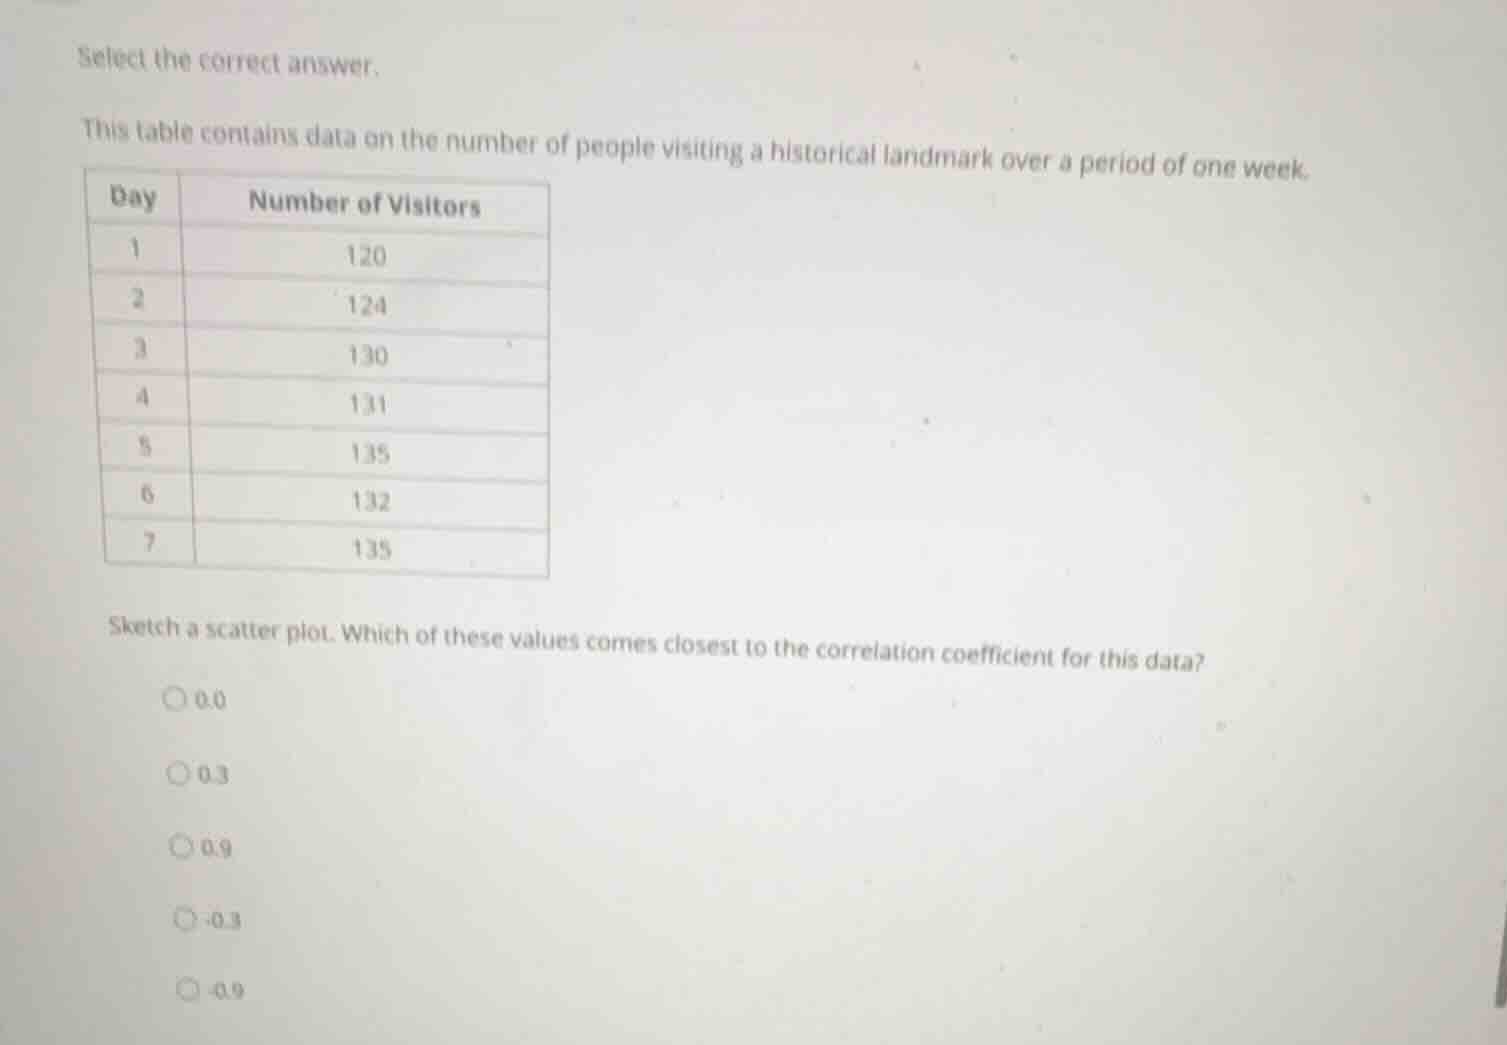
this table contains data on the number of people visiting a historical landmark over a period of one week.
\
$$\begin{array}{|c|c|}
\\hline
\\text{day} & \\text{number of visitors} \\\\
\\hline
1 & 120 \\\\
\\hline
2 & 124 \\\\
\\hline
3 & 130 \\\\
\\hline
4 & 131 \\\\
\\hline
5 & 135 \\\\
\\hline
6 & 132 \\\\
\\hline
7 & 135 \\\\
\\hline
\\end{array}$$
sketch a scatter plot. which of these values comes closest to the correlation coefficient for this data?
\bigcirc\\ 0.0
\bigcirc\\ 0.3
\bigcirc\\ 0.9
\bigcirc\\ -0.3
\bigcirc\\ -0.9
Calculate summary statistics for the data
$$
LATEXBLOCK0
$$
Calculate the sum of products and standard deviation of y
$$
LATEXBLOCK1
$$
Calculate the correlation coefficient r
$$
LATEXBLOCK2
$$

Snap & solve any problem in the app
Get step-by-step solutions on Sovi AI
Photo-based solutions with guided steps
Explore more problems and detailed explanations
- (A) 0.0
- (B) 0.3
- (C) 0.9 (Correct answer)
- (D) -0.3
- (E) -0.9