QUESTION IMAGE
Question
select the correct answer from each drop-down menu.
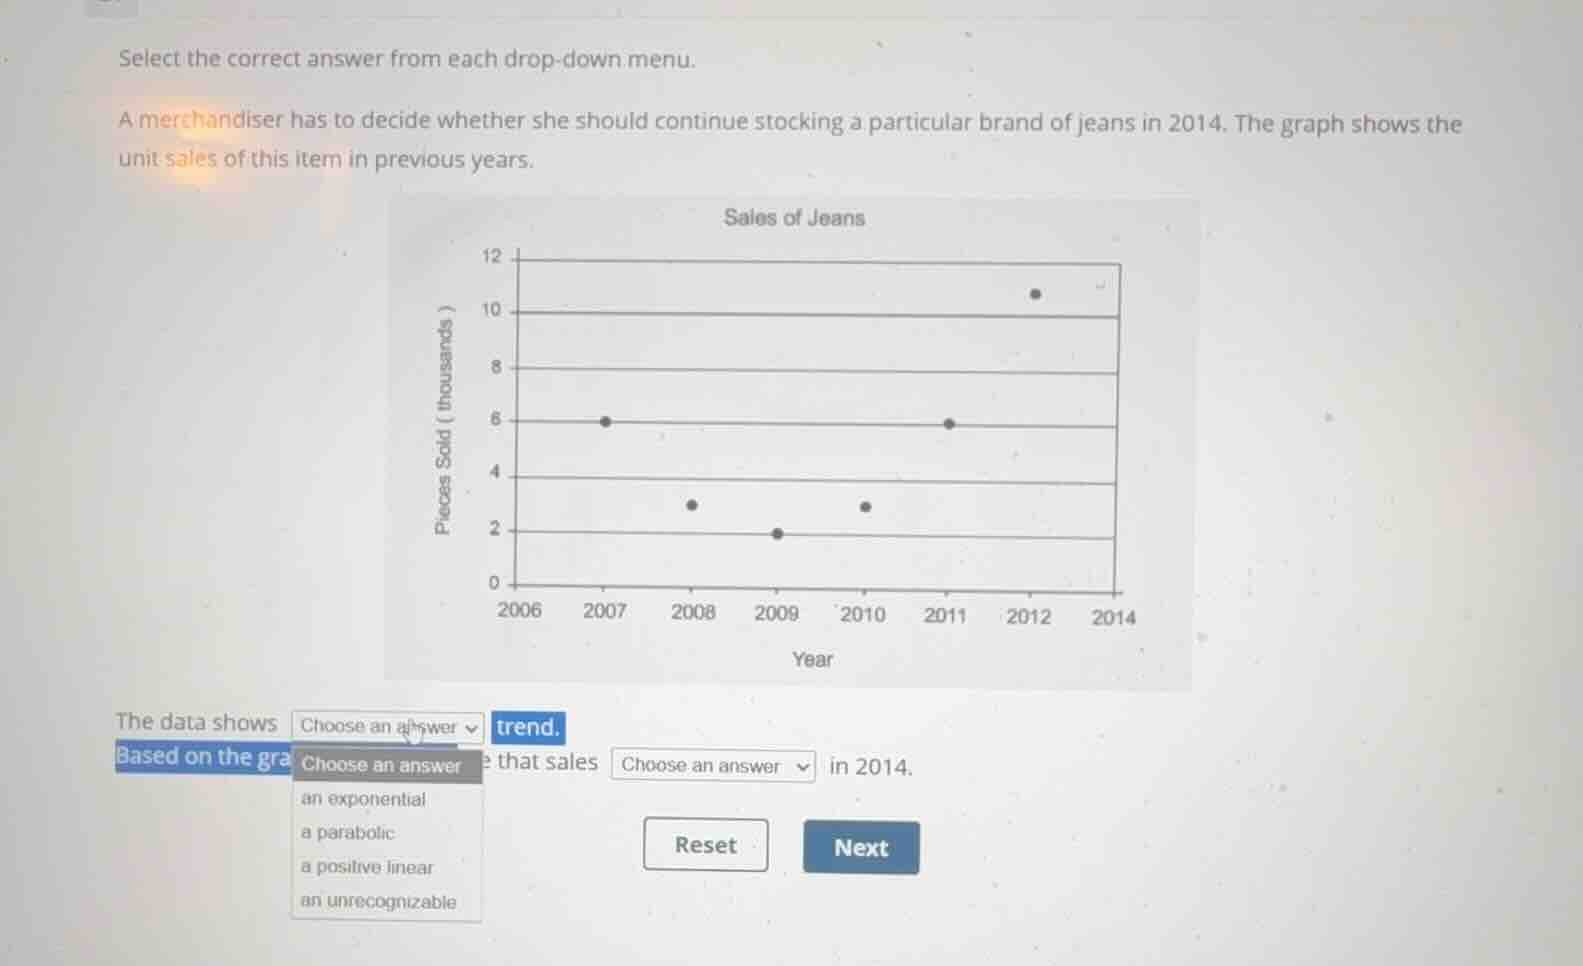
a merchandiser has to decide whether she should continue stocking a particular brand of jeans in 2014. the graph shows the unit sales of this item in previous years.
the data shows choose an answer trend.
based on the graph, it is choose an answer that sales choose an answer in 2014.
options for the first drop-down:
an exponential
a parabolic
a positive linear
an unrecognizable
Analyze the trend of the scatter plot
The data points plotted are:
- 2007: 6 thousand
- 2008: 3 thousand
- 2009: 2 thousand
- 2010: 3 thousand
- 2011: 6 thousand
- 2012: 11 thousand
The values decrease from 2007 to 2009 and then increase from 2009 to 2012, forming a symmetric U-shape. This represents a parabolic trend.
Determine the prediction for 2014
Since the trend is parabolic (opening upwards), the sales are expected to continue increasing after 2012. Therefore, it is reasonable to predict that sales will increase in 2014.

Snap & solve any problem in the app
Get step-by-step solutions on Sovi AI
Photo-based solutions with guided steps
Explore more problems and detailed explanations
Select the correct answer from each drop-down menu.
A merchandiser has to decide whether she should continue stocking a particular brand of jeans in 2014. The graph shows the unit sales of this item in previous years.
The data shows <blank>a parabolic</blank> trend.
Based on the graph, it is reasonable to assume that sales <blank>will increase</blank> in 2014.