QUESTION IMAGE
Question
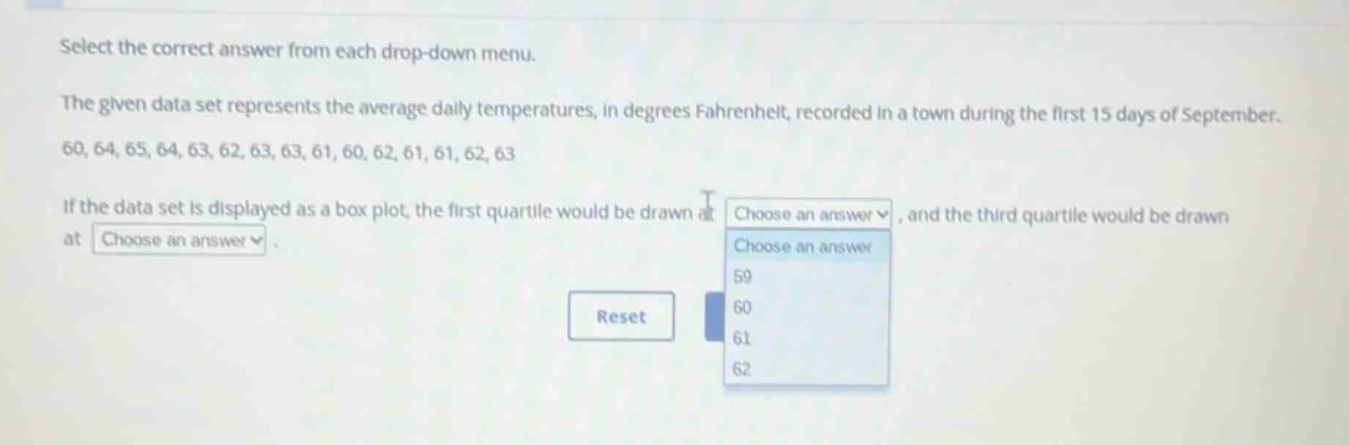
select the correct answer from each drop-down menu.
the given data set represents the average daily temperatures, in degrees fahrenheit, recorded in a town during the first 15 days of september.
60, 64, 65, 64, 63, 62, 63, 63, 61, 60, 62, 61, 61, 62, 63
if the data set is displayed as a box plot, the first quartile would be drawn at choose an answer, and the third quartile would be drawn at choose an answer.
⚡ Using what you learned: displaying data: histograms & box plots
Step 1: Order the data set
Arrange the 15 data points in ascending order:
Step 2: Find the median
The median is the middle value (the 8th value in a data set of 15 points):
Step 3: Find the first quartile (Q1)
The first quartile is the median of the lower half of the data (the first 7 values):
The middle value of this lower half (the 4th value) is:
Step 4: Find the third quartile (Q3)
The third quartile is the median of the upper half of the data (the last 7 values):
The middle value of this upper half (the 12th value overall) is:

Snap & solve any problem in the app
Get step-by-step solutions on Sovi AI
Photo-based solutions with guided steps
Explore more problems and detailed explanations
- First quartile: 61
- Third quartile: 63