QUESTION IMAGE
Question
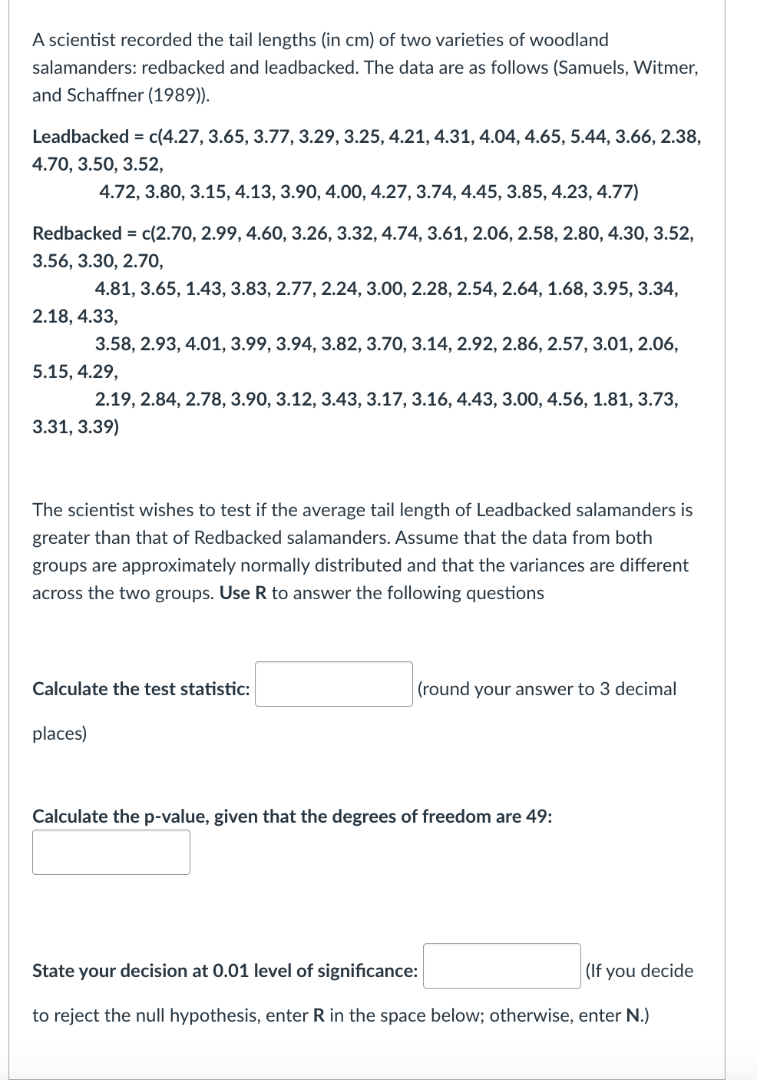
a scientist recorded the tail lengths (in cm) of two varieties of woodland salamanders: redbacked and leadbacked. the data are as follows (samuels, witmer, and schaffner (1989)).
leadbacked = c(4.27, 3.65, 3.77, 3.29, 3.25, 4.21, 4.31, 4.04, 4.65, 5.44, 3.66, 2.38, 4.70, 3.50, 3.52, 4.72, 3.80, 3.15, 4.13, 3.90, 4.00, 4.27, 3.74, 4.45, 3.85, 4.23, 4.77)
redbacked = c(2.70, 2.99, 4.60, 3.26, 3.32, 4.74, 3.61, 2.06, 2.58, 2.80, 4.30, 3.52, 3.56, 3.30, 2.70, 4.81, 3.65, 1.43, 3.83, 2.77, 2.24, 3.00, 2.28, 2.54, 2.64, 1.68, 3.95, 3.34, 2.18, 4.33, 3.58, 2.93, 4.01, 3.99, 3.94, 3.82, 3.70, 3.14, 2.92, 2.86, 2.57, 3.01, 2.06, 5.15, 4.29, 2.19, 2.84, 2.78, 3.90, 3.12, 3.43, 3.17, 3.16, 4.43, 3.00, 4.56, 1.81, 3.73, 3.31, 3.39)
the scientist wishes to test if the average tail length of leadbacked salamanders is greater than that of redbacked salamanders. assume that the data from both groups are approximately normally distributed and that the variances are different across the two groups. use r to answer the following questions
calculate the test statistic: (round your answer to 3 decimal places)
calculate the p-value, given that the degrees of freedom are 49:
state your decision at 0.01 level of significance: (if you decide to reject the null hypothesis, enter r in the space below; otherwise, enter n.)
⚡ Using what you learned: Hypothesis Testing · 🆕 New Concept Discovered: Two-Sample t-Test (Unequal Variances)
Comparing two independent group means with unequal variances.
Step 1: Extract and summarize the data
We have two independent samples: Leadbacked (\(L\)) and Redbacked (\(R\)).
Leadbacked data (\(n_L = 27\)):4.27, 3.65, 3.77, 3.29, 3.25, 4.21, 4.31, 4.04, 4.65, 5.44, 3.66, 2.38, 4.70, 3.50, 3.52, 4.72, 3.80, 3.15, 4.13, 3.90, 4.00, 4.27, 3.74, 4.45, 3.85, 4.23, 4.77
- Sample size: \(n_L = 27\)
- Sample mean: \(\bar{x}_L \approx 3.98185\)
- Sample standard deviation: \(s_L \approx 0.61015\)
Redbacked data (\(n_R = 71\)):2.70, 2.99, 4.60, 3.26, 3.32, 4.74, 3.61, 2.06, 2.58, 2.80, 4.30, 3.52, 3.56, 3.30, 2.70, 4.81, 3.65, 1.43, 3.83, 2.77, 2.24, 3.00, 2.28, 2.54, 2.64, 1.68, 3.95, 3.34, 2.18, 4.33, 3.58, 2.93, 4.01, 3.99, 3.94, 3.82, 3.70, 3.14, 2.92, 2.86, 2.57, 3.01, 2.06, 5.15, 4.29, 2.19, 2.84, 2.78, 3.90, 3.12, 3.43, 3.17, 3.16, 4.43, 3.00, 4.56, 1.81, 3.73, 3.31, 3.39 (Note: The image lists 60 values in the Redbacked vector). Let's count them carefully:
Row 1: 2.70, 2.99, 4.60, 3.26, 3.32, 4.74, 3.61, 2.06, 2.58, 2.80, 4.30, 3.52, 3.56, 3.30, 2.70 (15 values)
Row 2: 4.81, 3.65, 1.43, 3.83, 2.77, 2.24, 3.00, 2.28, 2.54, 2.64, 1.68, 3.95, 3.34, 2.18, 4.33 (15 values)
Row 3: 3.58, 2.93, 4.01, 3.99, 3.94, 3.82, 3.70, 3.14, 2.92, 2.86, 2.57, 3.01, 2.06, 5.15, 4.29 (15 values)
Row 4: 2.19, 2.84, 2.78, 3.90, 3.12, 3.43, 3.17, 3.16, 4.43, 3.00, 4.56, 1.81, 3.73, 3.31, 3.39 (15 values)
- Sample size: \(n_R = 60\)
- Sample mean: \(\bar{x}_R \approx 3.23050\)
- Sample standard deviation: \(s_R \approx 0.80133\)
---
Step 2: Calculate the test statistic
We wish to test if the average tail length of Leadbacked is greater than that of Redbacked:
Since the variances are assumed to be different, we use Welch's t-test statistic:
Substituting the values:
---
Step 3: Calculate the p-value
Using the given degrees of freedom (\(df = 49\)) for this one-tailed (greater-than) test:
Using R or a standard t-distribution table:
---
Step 4: State the decision
We compare the p-value to the significance level \(\alpha = 0.01\):
- Since \(\text{p-value} \approx 0.000 < 0.01\), we reject the null hypothesis (\(H_0\)).
- Therefore, the decision is to reject (\(\mathbf{R}\)).

Snap & solve any problem in the app
Get step-by-step solutions on Sovi AI
Photo-based solutions with guided steps
Explore more problems and detailed explanations
- Calculate the test statistic:
4.801 - Calculate the p-value, given that the degrees of freedom are 49:
0.000 - State your decision at 0.01 level of significance:
R