QUESTION IMAGE
Question
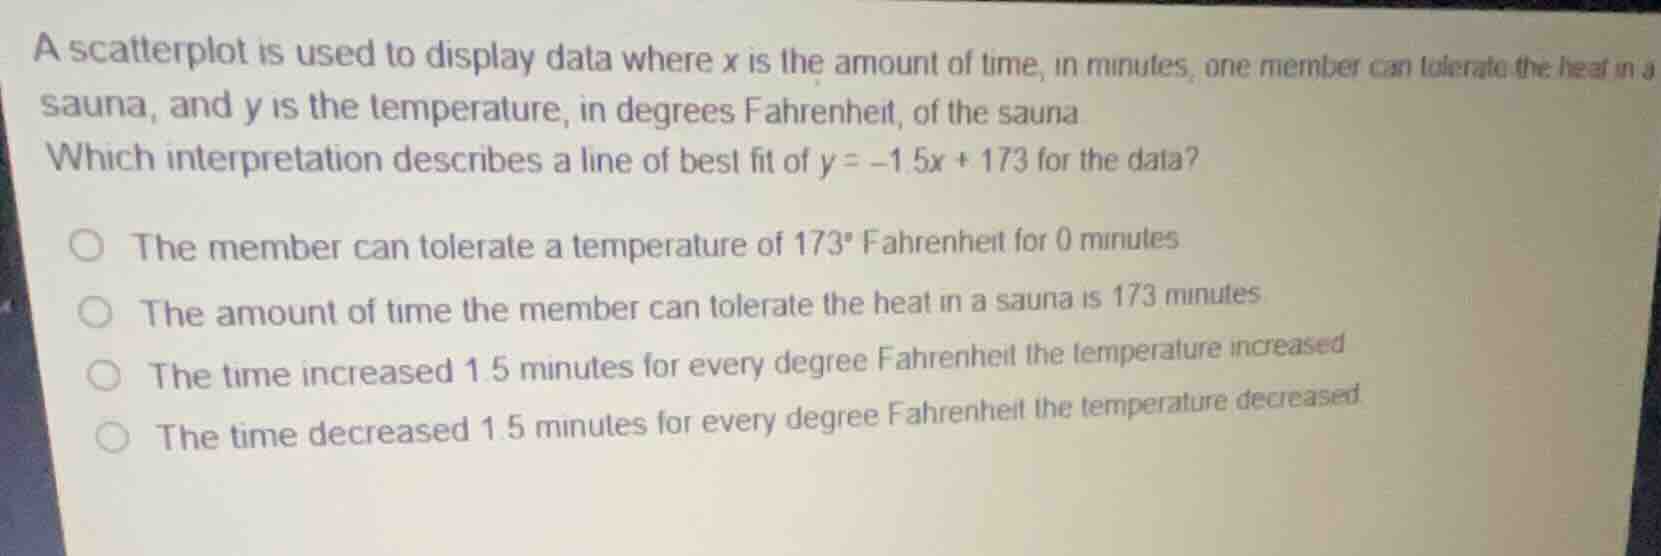
a scatterplot is used to display data where x is the amount of time, in minutes, one member can tolerate the heat in a sauna, and y is the temperature, in degrees fahrenheit, of the sauna.
which interpretation describes a line of best fit of \\(y = -1.5x + 173\\) for the data?
- the member can tolerate a temperature of \\(173^\circ\\) fahrenheit for 0 minutes.
- the amount of time the member can tolerate the heat in a sauna is 173 minutes.
- the time increased 1.5 minutes for every degree fahrenheit the temperature increased.
- the time decreased 1.5 minutes for every degree fahrenheit the temperature decreased.
Identify variables and model parameters
$$
LATEXBLOCK0
$$
Interpret the y-intercept
$$
LATEXBLOCK1
$$
Match with given options
$$
LATEXBLOCK2
$$

Snap & solve any problem in the app
Get step-by-step solutions on Sovi AI
Photo-based solutions with guided steps
Explore more problems and detailed explanations
- (A) The member can tolerate a temperature of 173° Fahrenheit for 0 minutes. (Correct answer)
- (B) The amount of time the member can tolerate the heat in a sauna is 173 minutes.
- (C) The time increased 1.5 minutes for every degree Fahrenheit the temperature increased.
- (D) The time decreased 1.5 minutes for every degree Fahrenheit the temperature decreased.