QUESTION IMAGE
Question
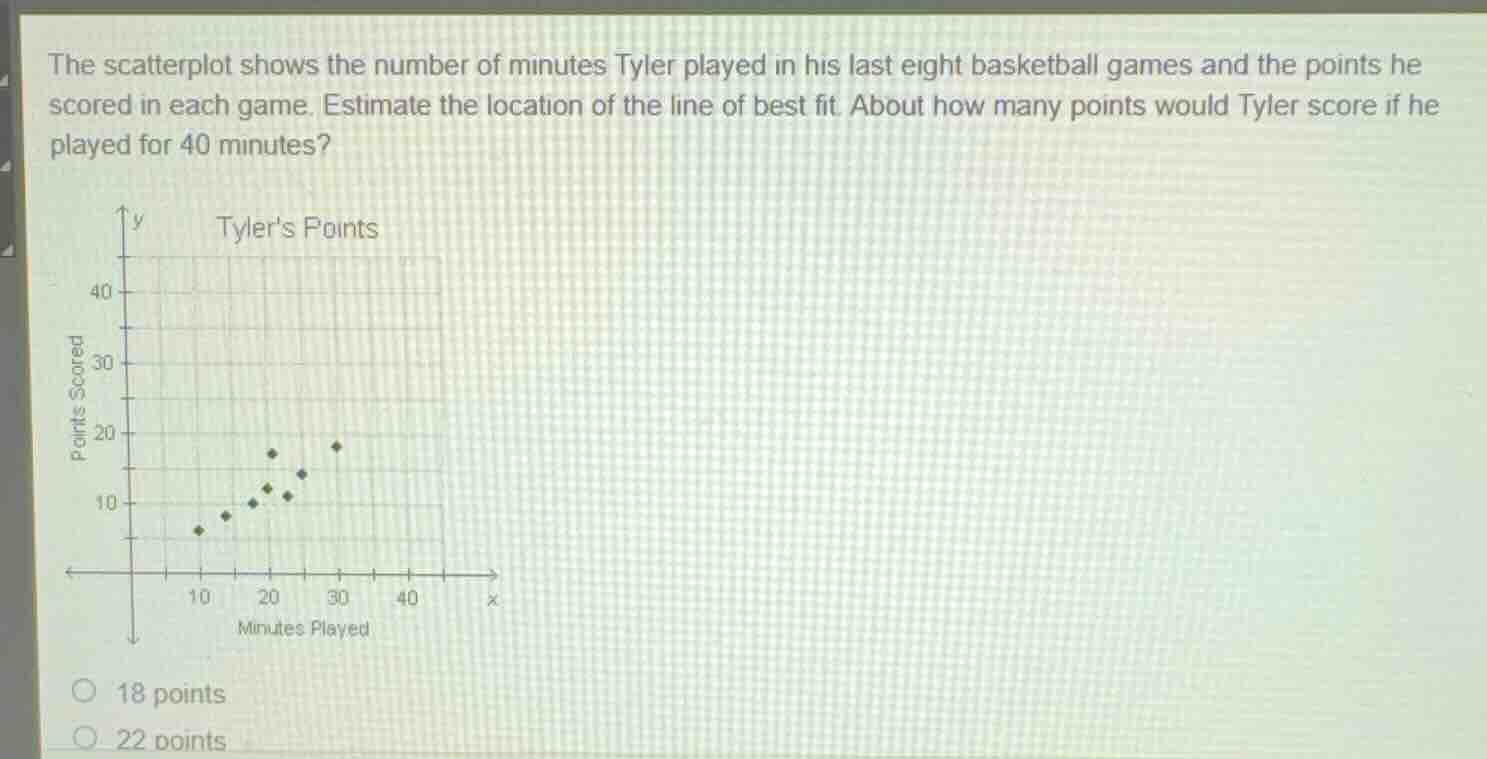
the scatterplot shows the number of minutes tyler played in his last eight basketball games and the points he scored in each game. estimate the location of the line of best fit. about how many points would tyler score if he played for 40 minutes?
18 points
22 points
Identify data points from the scatterplot
The scatterplot shows the following eight data points representing (Minutes Played, Points Scored):
- \((10, 6)\)
- \((14, 8)\)
- \((18, 10)\)
- \((20, 12)\)
- \((21, 17)\)
- \((23, 11)\)
- \((25, 14)\)
- \((30, 18)\)
Determine the line of best fit
Using the Linear Modeling knowledge point
Estimate the score for 40 minutes
Using the Linear Modeling knowledge point
Compare with the given options
The options visible are:
- 18 points
- 22 points
Since \(24\) is closest to \(22\) points (and significantly higher than \(18\) points), \(22\) points is the most reasonable estimate among the choices.

Snap & solve any problem in the app
Get step-by-step solutions on Sovi AI
Photo-based solutions with guided steps
Explore more problems and detailed explanations
- (A) 18 points
- (B) 22 points (Correct answer)