QUESTION IMAGE
Question
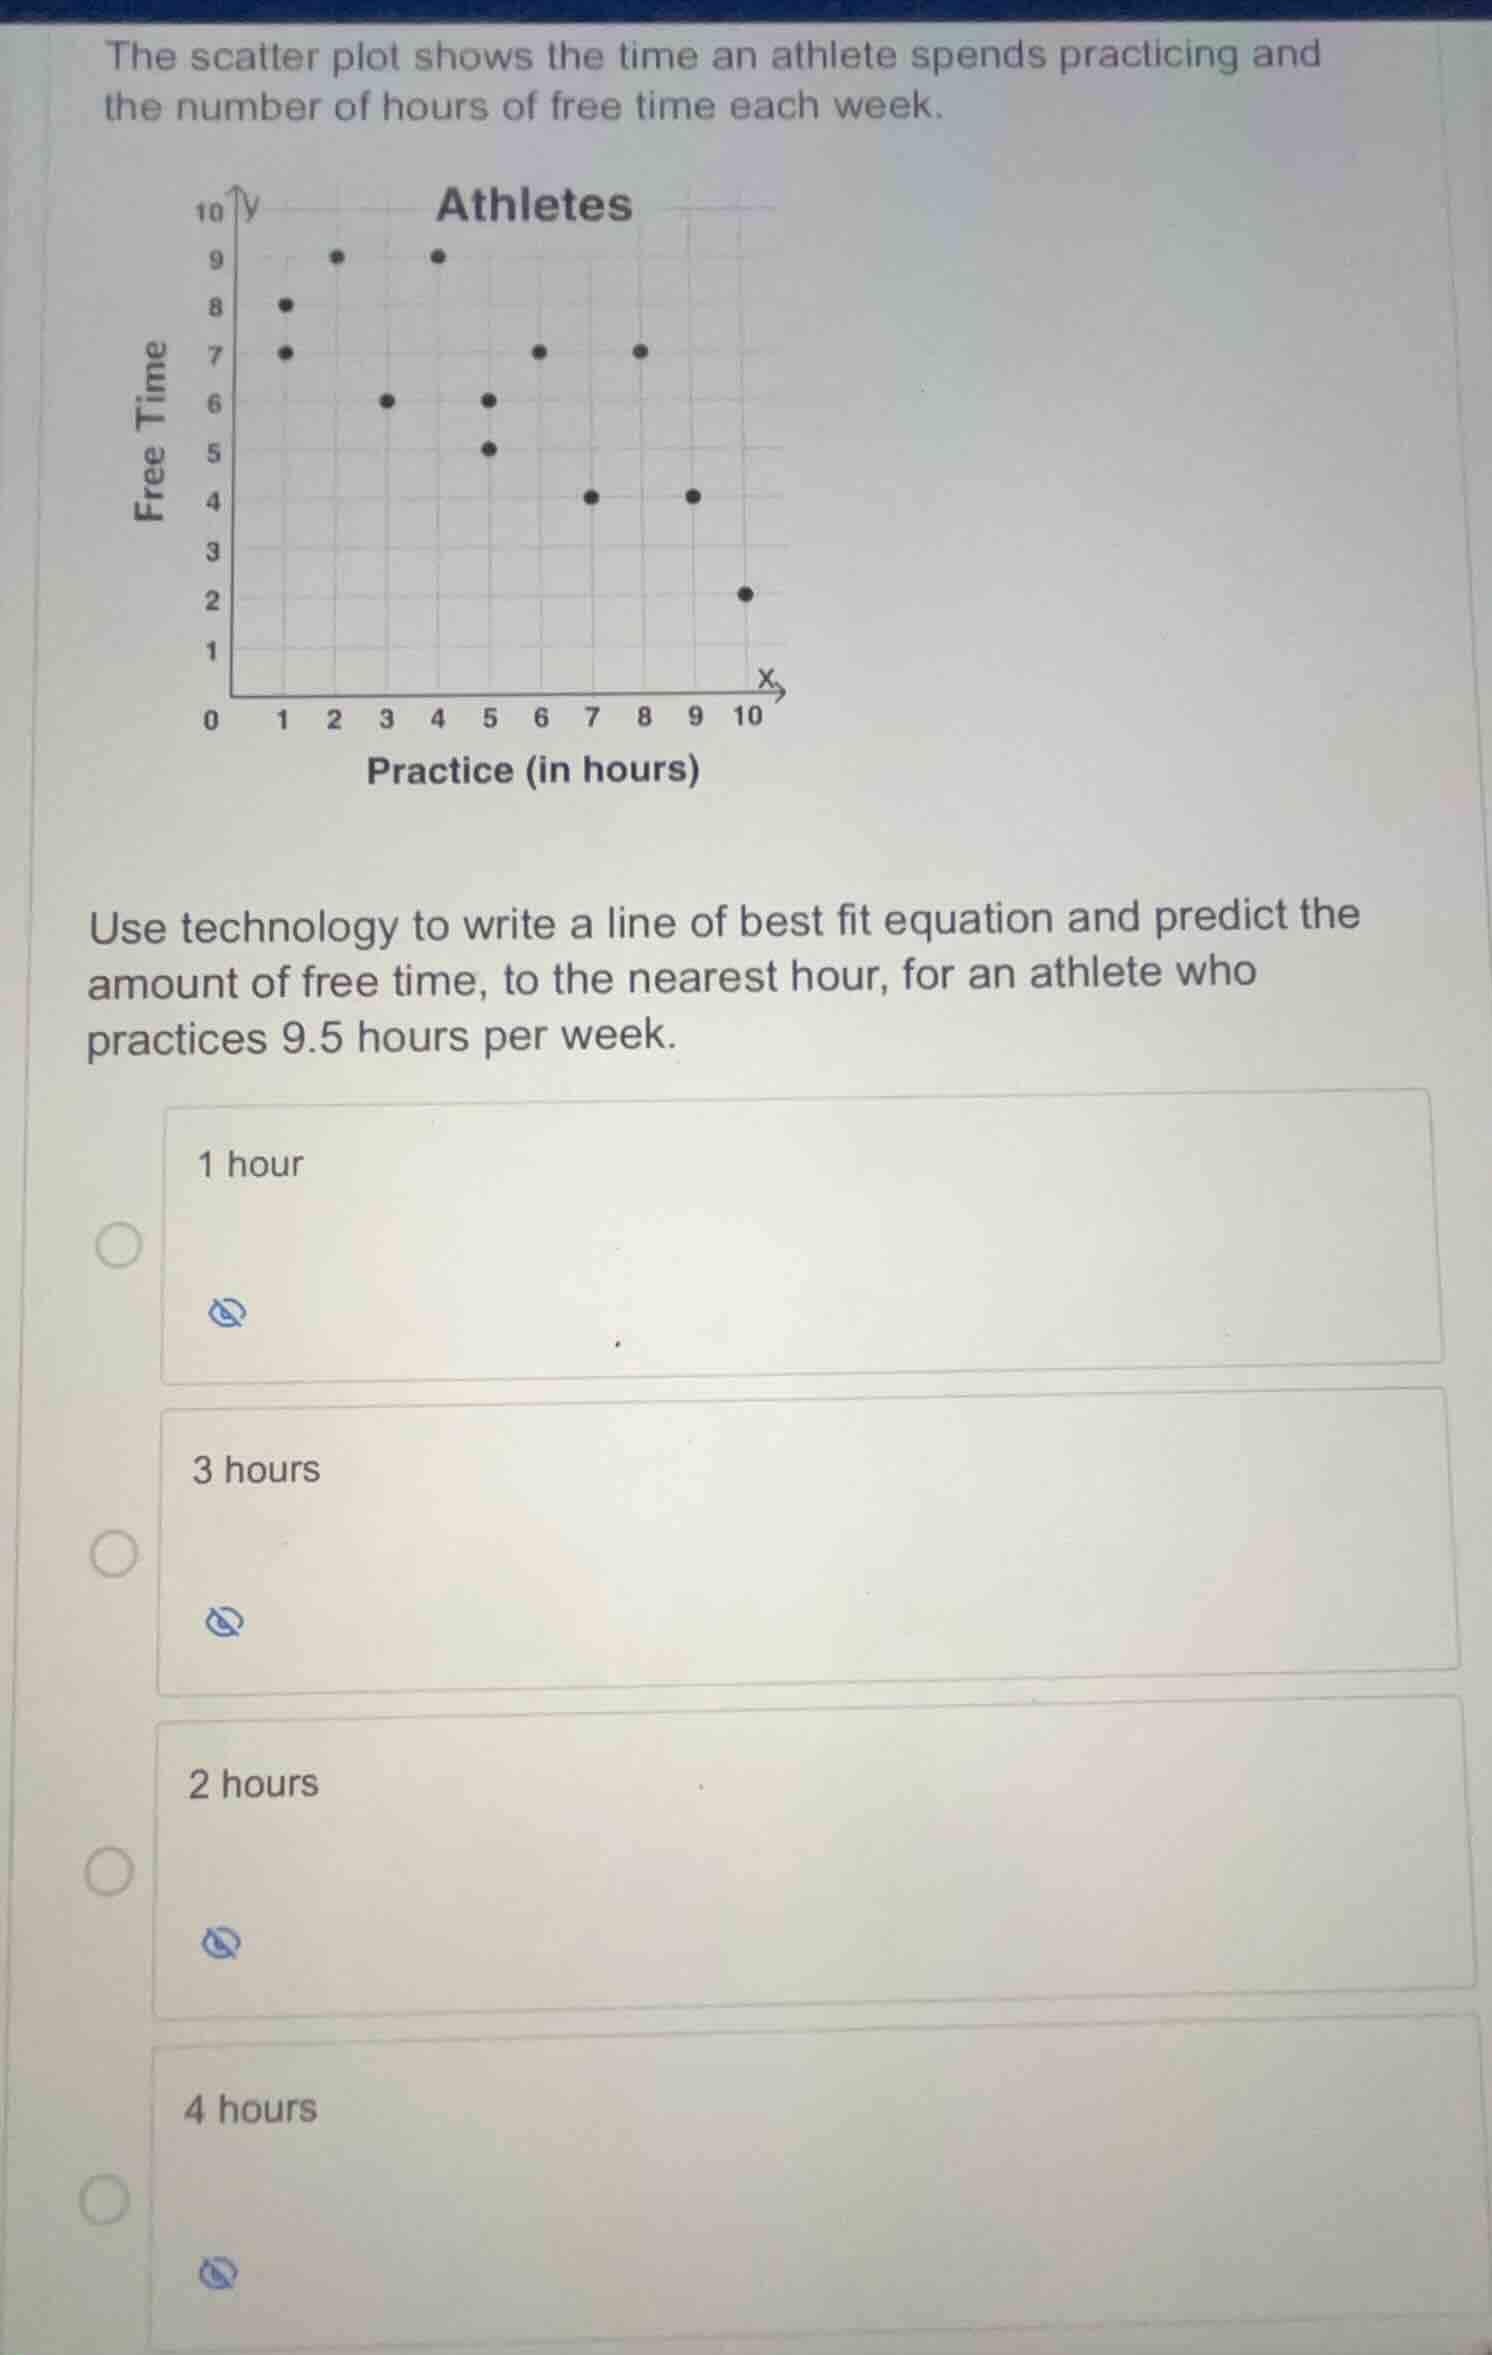
the scatter plot shows the time an athlete spends practicing and the number of hours of free time each week.
use technology to write a line of best fit equation and predict the amount of free time, to the nearest hour, for an athlete who practices 9.5 hours per week.
1 hour
3 hours
2 hours
4 hours
Identify data points from the scatter plot
The coordinates \((x, y)\) representing (Practice, Free Time) are:
$$
(1, 7), (1, 8), (2, 9), (3, 6), (4, 9), (5, 5), (5, 6), (6, 7), (7, 4), (8, 7), (9, 4), (10, 2)
$$
Calculate the line of best fit
Using linear regression formulas:
$$
LATEXBLOCK0
$$
The line of best fit equation is:
$$
y \approx -0.517x + 8.795
$$
Predict free time for 9.5 hours of practice
Substitute \(x = 9.5\) into the regression equation:
$$
y \approx -0.517(9.5) + 8.795 \approx -4.9115 + 8.795 = 3.8835
$$
Rounding to the nearest hour gives:
$$
y \approx 4\text{ hours}
$$

Snap & solve any problem in the app
Get step-by-step solutions on Sovi AI
Photo-based solutions with guided steps
Explore more problems and detailed explanations
- 1 hour
- 3 hours
- 2 hours
- 4 hours (Correct answer)