QUESTION IMAGE
Question
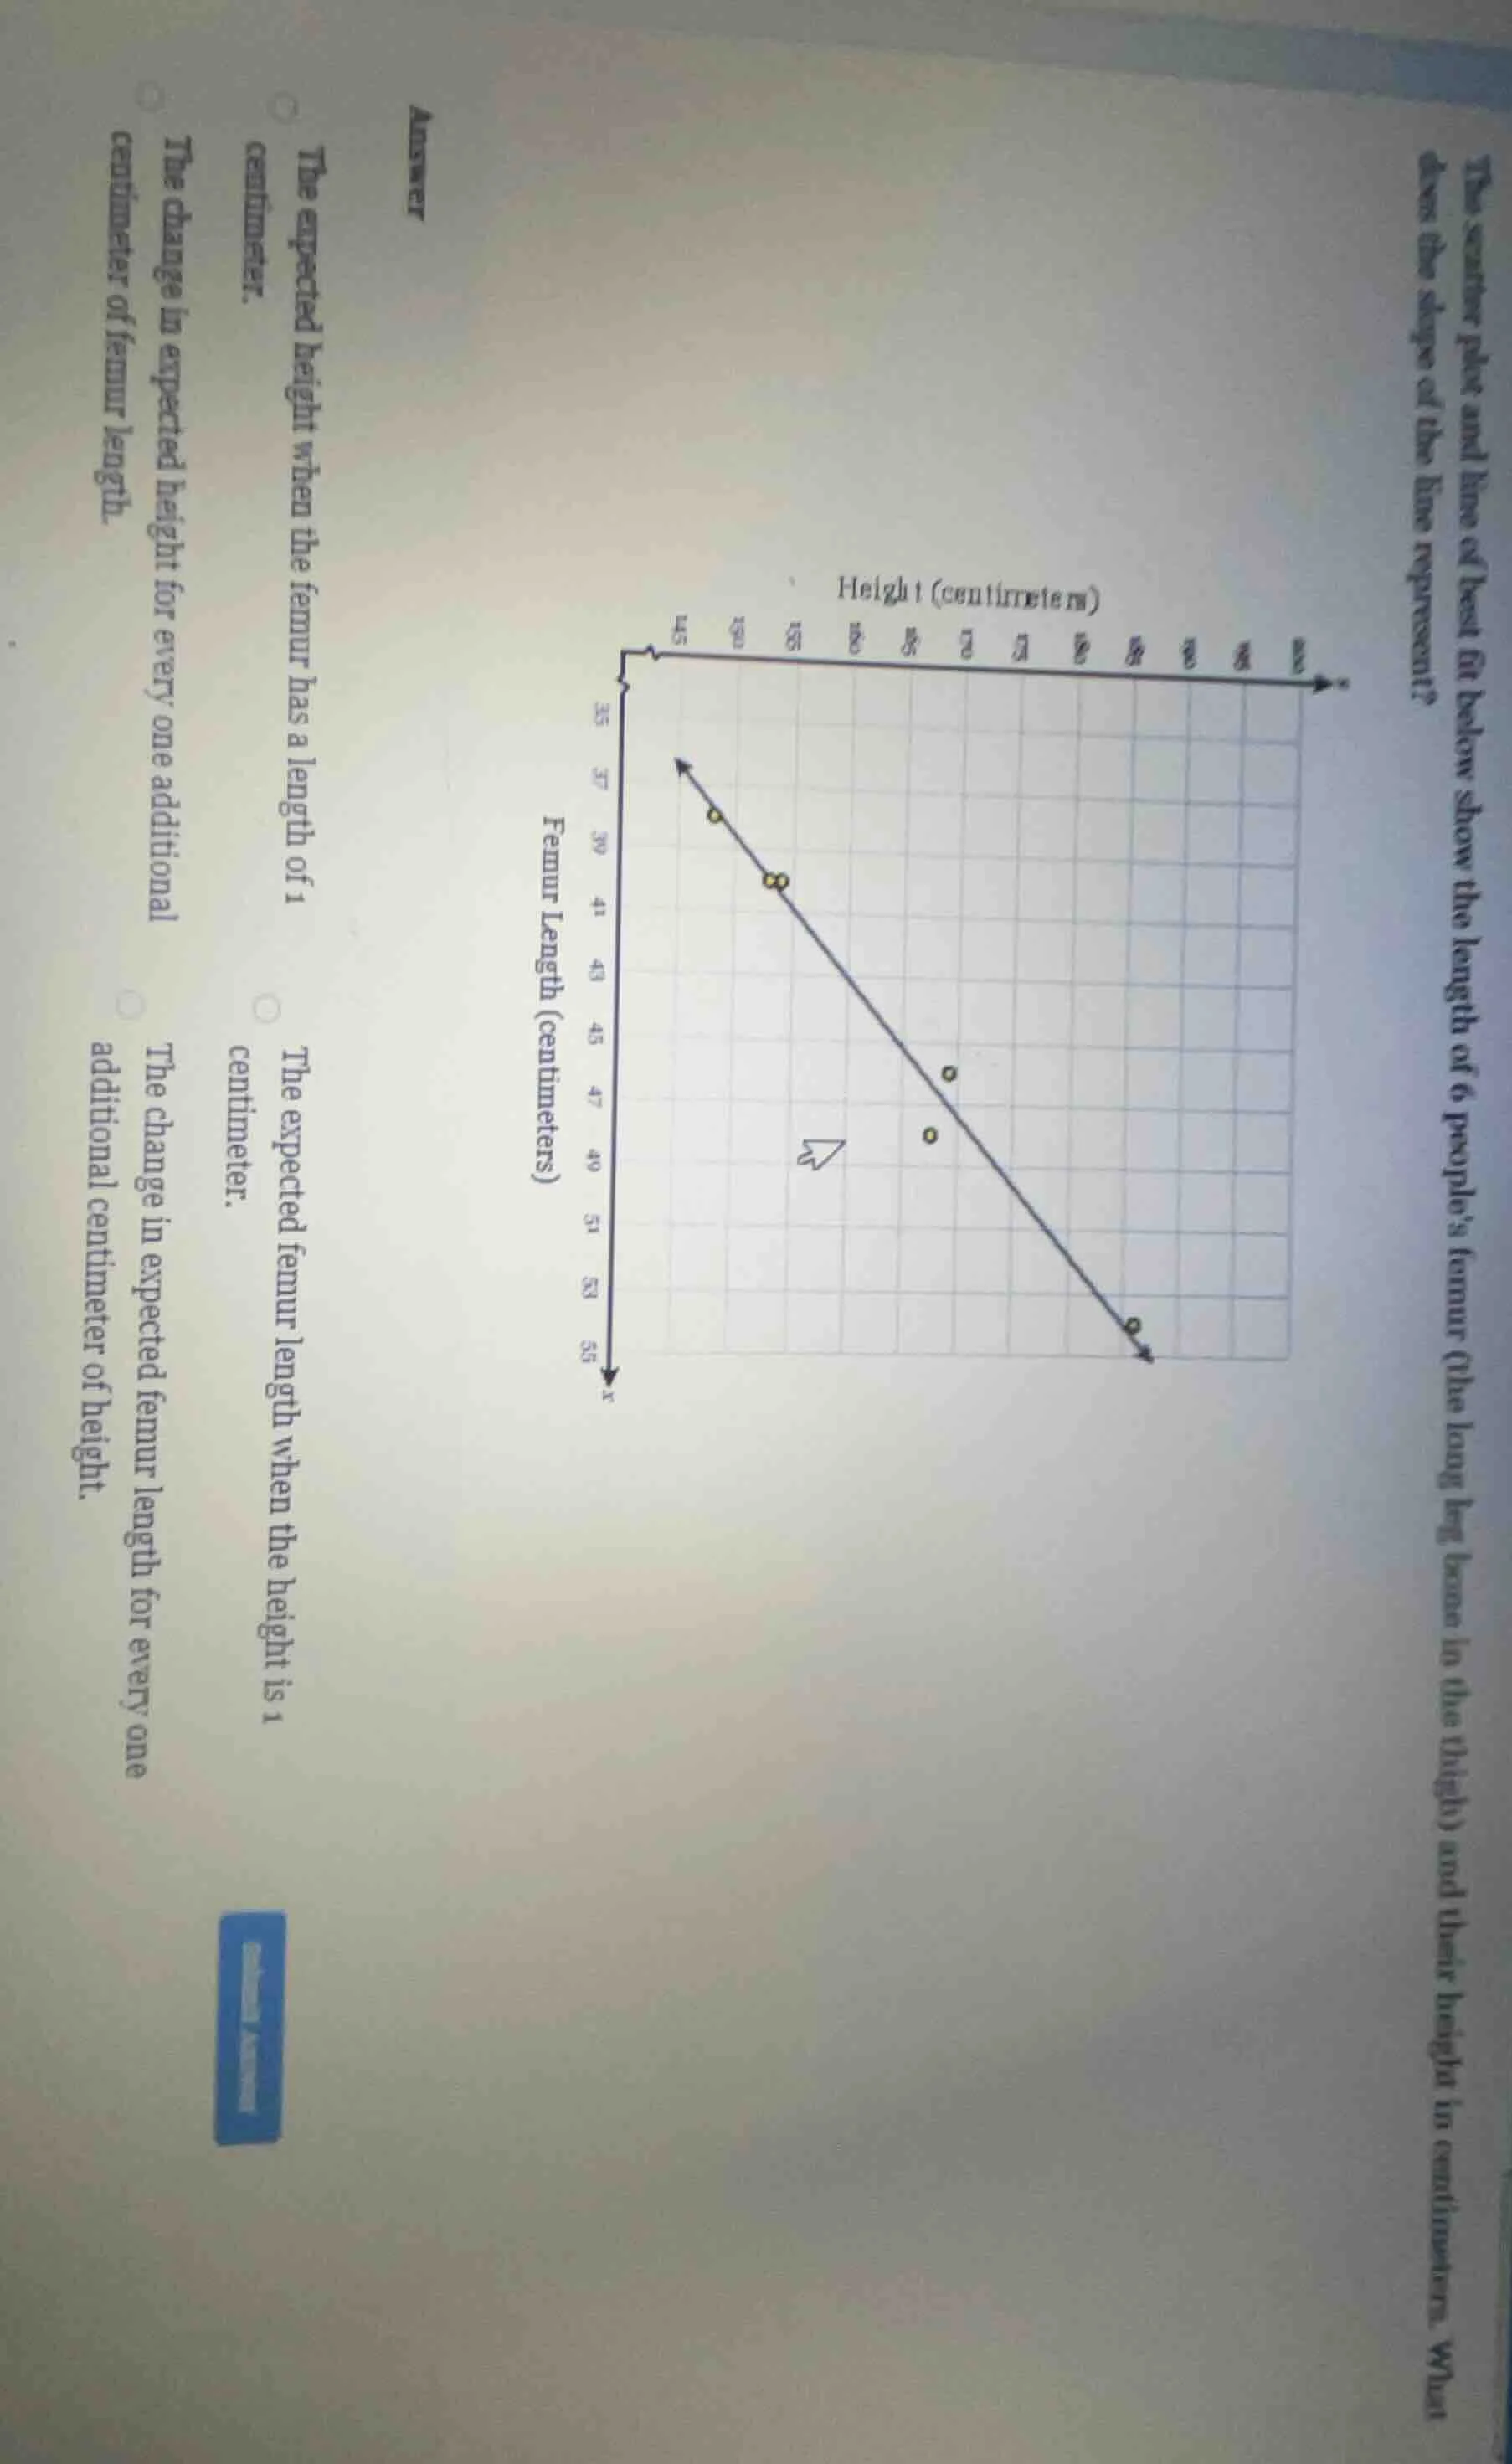
the scatter plot and line of best fit below show the length of 6 peoples femur (the long leg bone in the thigh) and their height in centimeters. what does the slope of the line represent?
answer
the expected height when the femur has a length of 1 centimeter.
the expected femur length when the height is 1 centimeter.
the change in expected height for every one additional centimeter of femur length.
the change in expected femur length for every one additional centimeter of height.
The x-axis (independent variable) is femur length, and the y-axis (dependent variable) is height. The slope of a line of best fit represents the change in the dependent variable for a 1-unit increase in the independent variable. Here, that means the change in expected height for each additional centimeter of femur length.

Snap & solve any problem in the app
Get step-by-step solutions on Sovi AI
Photo-based solutions with guided steps
Explore more problems and detailed explanations
The change in expected height for every one additional centimeter of femur length.