QUESTION IMAGE
Question
review percentile, quartile, media
- quartiles
are the three numbers that separate a sorted data set into four equal parts.
-the second quartile is the median (it cuts the data in half)
-the first, or lowest quartile is the median of the lowest data set (it is the first quarter of the data set)
-the third, or upper, quartile is the median of the data values greater than the second quartile (it is the highest quarter of the data set)
interquartile range (iqr) = q3 - q1
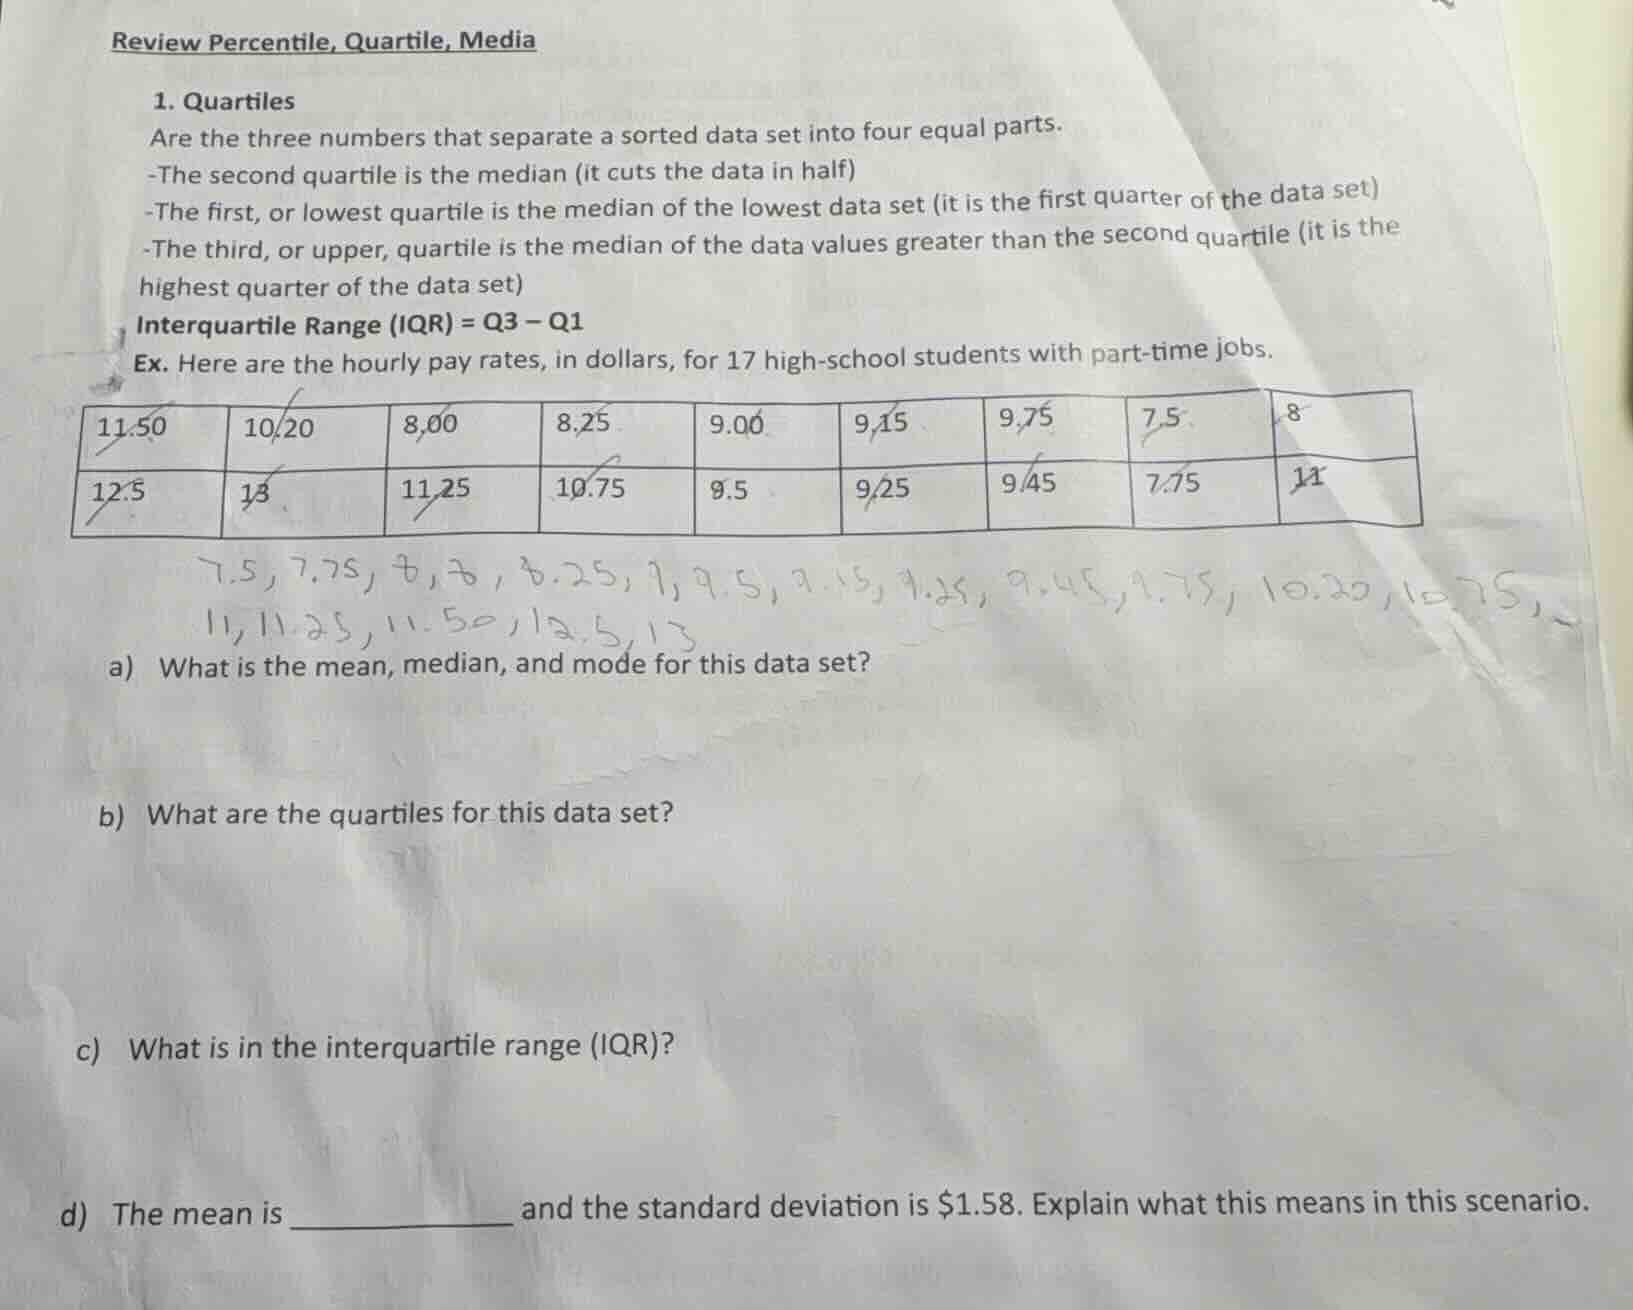
ex. here are the hourly pay rates, in dollars, for 17 high-school students with part-time jobs.
\
a) what is the mean, median, and mode for this data set?
b) what are the quartiles for this data set?
c) what is in the interquartile range (iqr)?
d) the mean is \\_\\_\\_\\_\\_\\_\\_\\_\\_\\_ and the standard deviation is \\$1.58. explain what this means in this scenario.
Sort the data set
To analyze the hourly pay rates of the \(17\) students, we first list and sort the data values in ascending order.
The raw data values from the table are:
\(11.50, 10.20, 8.00, 8.25, 9.00, 9.15, 9.75, 7.50, 8.00\) (written as \(8\))
\(12.50, 13.00, 11.25, 10.75, 9.50, 9.25, 9.45, 7.75, 11.00\) (written as \(11\))
Let's count the values: there are \(18\) cells in the grid, but the prompt states there are \(17\) students. Looking closely at the grid:
Row 1: \(11.50, 10.20, 8.00, 8.25, 9.00, 9.15, 9.75, 7.5, 8\)
Row 2: \(12.5, 13, 11.25, 10.75, 9.5, 9.25, 9.45, 7.75, 11\)
This is indeed \(18\) numbers. Let's re-verify the handwritten list in the image:
\(7.5, 7.75, 8, 8, 8.25, 9, 9.5, 9.15, 9.25, 9.45, 9.75, 10.20, 10.75, 11, 11.25, 11.50, 12.5, 13\)
This handwritten list contains \(18\) values. We will use these \(18\) data points for our calculations:
Calculate mean, median, and mode
To find the mean, we sum all \(18\) values and divide by \(18\):
Since \(N = 18\) is even, the median is the average of the \(9\)-th and \(10\)-th values:
- \(9\)-th value: \(9.45\)
- \(10\)-th value: \(9.50\)
The mode is the value that appears most frequently:
- \(8.00\) appears twice. All other values appear once.
Determine the quartiles
To find the quartiles for \(N = 18\) data points:
The median splits the data into two halves of \(9\) values each:
- Lower half: \(7.50, 7.75, 8.00, 8.00, 8.25, 9.00, 9.15, 9.25, 9.45\)
- Upper half: \(9.50, 9.75, 10.20, 10.75, 11.00, 11.25, 11.50, 12.50, 13.00\)
The first quartile (\(Q_1\)) is the median of the lower half (\(5\)-th value):
The second quartile (\(Q_2\)) is the median of the entire data set:
The third quartile (\(Q_3\)) is the median of the upper half (\(5\)-th value of this half):
Calculate the interquartile range
The interquartile range (\(\text{IQR}\)) measures the spread of the middle \(50\%\) of the data:
Interpret mean and standard deviation
The mean hourly pay rate is approximately \(\$9.50\).
A standard deviation of \(\$1.58\) measures the typical dispersion of the individual pay rates from this mean.
This means that most students' hourly wages deviate from the average wage of \(\$9.50\) by about \(\$1.58\).

Snap & solve any problem in the app
Get step-by-step solutions on Sovi AI
Photo-based solutions with guided steps
Explore more problems and detailed explanations
Question a
- Mean: \(\$9.50\)
- Median: \(\$9.48\)
- Mode: \(\$8.00\)
Question b
- First Quartile (\(Q_1\)): \(\$8.25\)
- Second Quartile (\(Q_2\)/Median): \(\$9.48\)
- Third Quartile (\(Q_3\)): \(\$11.00\)
Question c
- Interquartile Range (IQR): \(\$2.75\)
Question d
The mean is \(\$9.50\) and the standard deviation is \(\$1.58\). This means that the average hourly pay rate for these students is \(\$9.50\), and the typical difference between an individual student's hourly pay rate and this average rate is approximately \(\$1.58\).