QUESTION IMAGE
Question
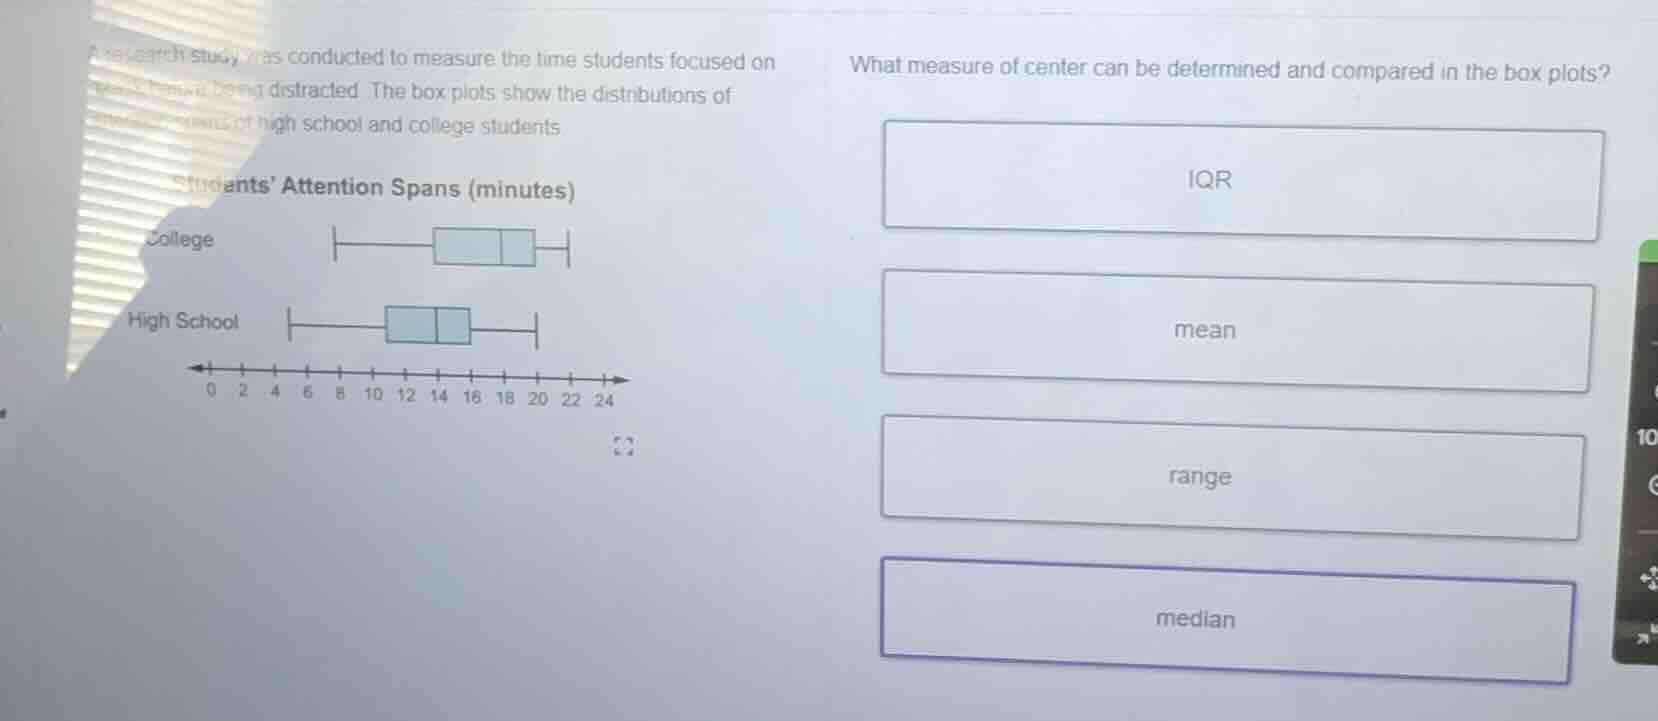
a research study was conducted to measure the time students focused on a task without being distracted. the box plots show the distributions of attention spans of high school and college students.
students attention spans (minutes)
college
high school
what measure of center can be determined and compared in the box plots?
- iqr
- mean
- range
- median
Identify the question and options
The question asks: "What measure of center can be determined and compared in the box plots?"
The options provided are:
- IQR
- mean
- range
- median
Analyze box plot components
A box plot visually displays the five-number summary of a dataset:
- Minimum
- First quartile (\(Q_1\))
- Median (\(Q_2\))
- Third quartile (\(Q_3\))
- Maximum
Evaluate the options against measures of center
- IQR (Interquartile Range) and range are measures of variability (spread), not measures of center.
- The mean is a measure of center, but it cannot be directly determined from a standard box plot without the raw data.
- The median is a measure of center and is represented by the vertical line inside the box of each box plot. Thus, it can be directly determined and compared.

Snap & solve any problem in the app
Get step-by-step solutions on Sovi AI
Photo-based solutions with guided steps
Explore more problems and detailed explanations
- IQR
- mean
- range
- median (Correct answer)