QUESTION IMAGE
Question
recognizing a relationship between two variables
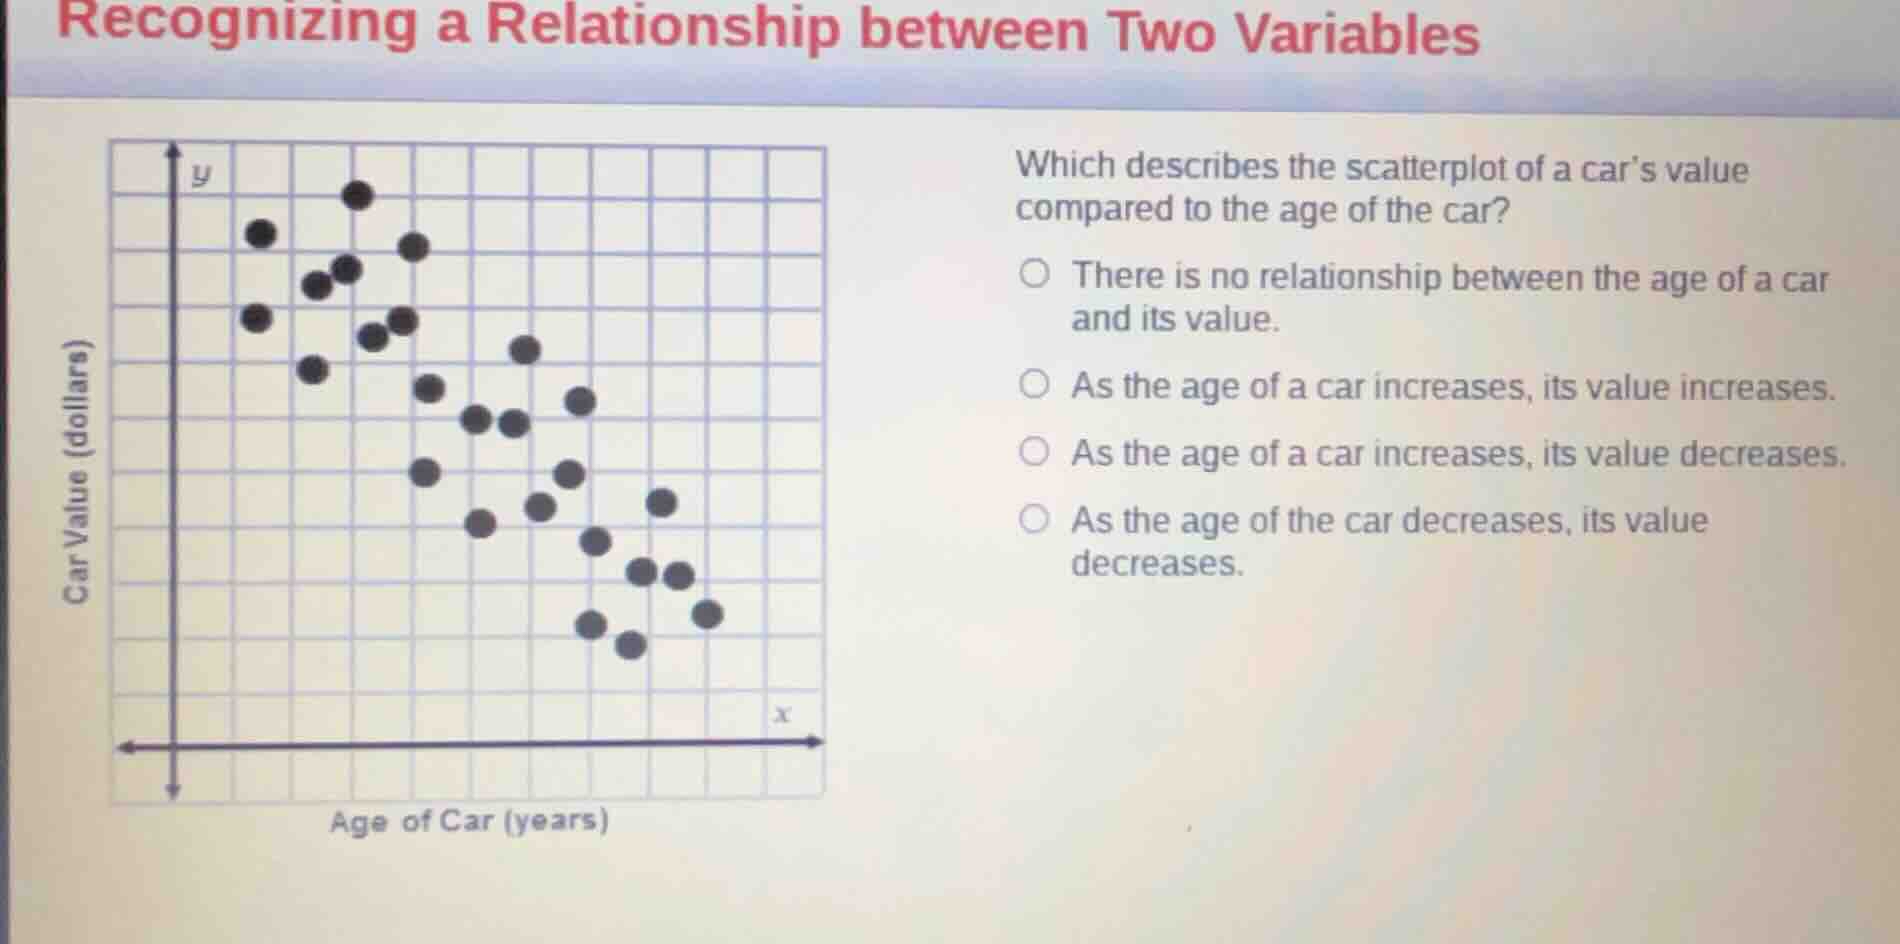
which describes the scatterplot of a cars value compared to the age of the car?
- there is no relationship between the age of a car and its value.
- as the age of a car increases, its value increases.
- as the age of a car increases, its value decreases.
- as the age of the car decreases, its value decreases.
Analyze the variables on the axes
The horizontal axis (\(x\)-axis) represents the "Age of Car (years)" and the vertical axis (\(y\)-axis) represents the "Car Value (dollars)".
Determine the trend of the data points
As we move from left to right along the \(x\)-axis (increasing age of the car), the plotted points generally move downwards along the \(y\)-axis (decreasing car value). This indicates a negative correlation.
Match the trend to the description
A negative correlation means that as the age of a car increases, its value decreases. This directly matches the third option.

Snap & solve any problem in the app
Get step-by-step solutions on Sovi AI
Photo-based solutions with guided steps
Explore more problems and detailed explanations
- There is no relationship between the age of a car and its value.
- As the age of a car increases, its value increases.
- As the age of a car increases, its value decreases. (Correct answer)
- As the age of the car decreases, its value decreases.