QUESTION IMAGE
Question
question 3
4 pts
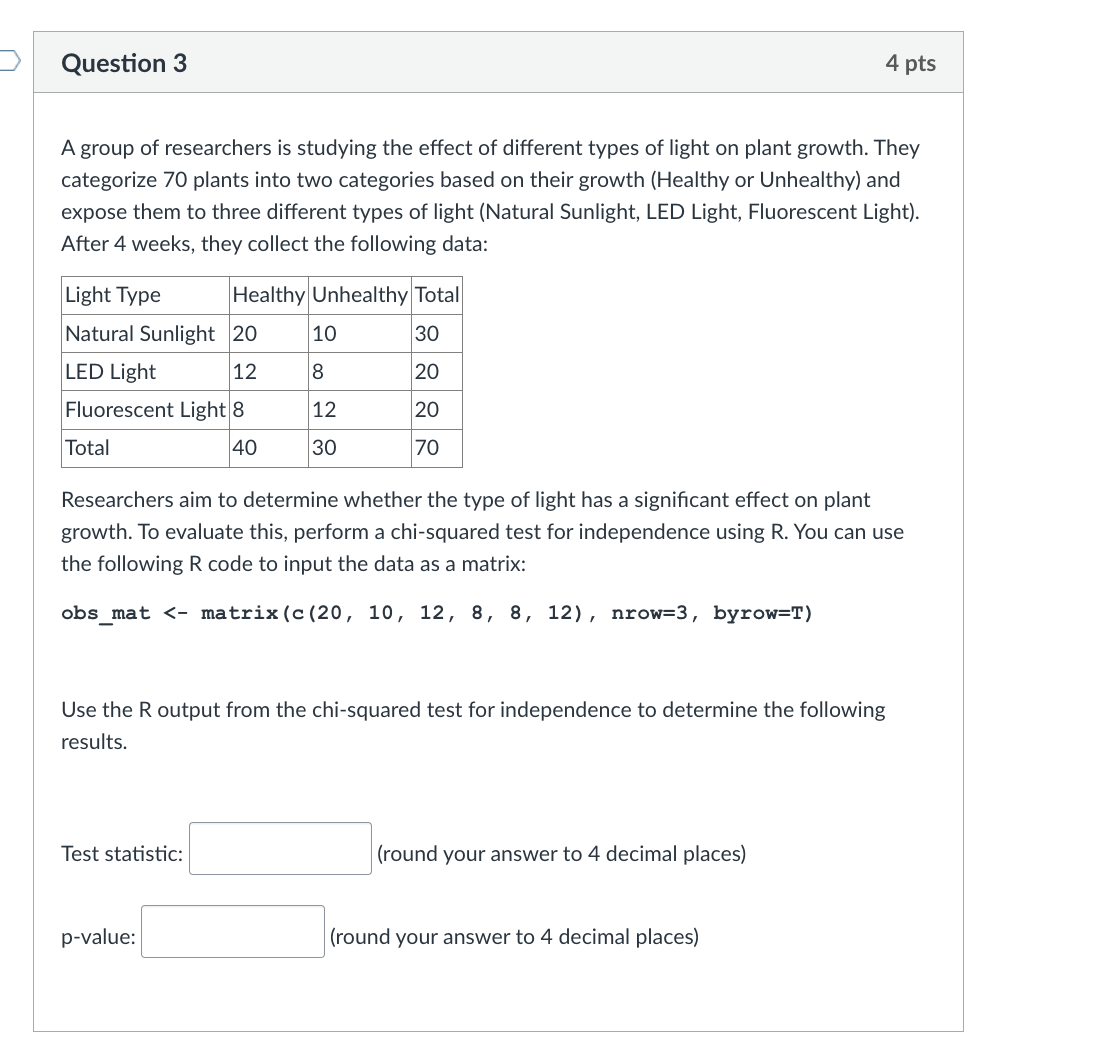
a group of researchers is studying the effect of different types of light on plant growth. they categorize 70 plants into two categories based on their growth (healthy or unhealthy) and expose them to three different types of light (natural sunlight, led light, fluorescent light). after 4 weeks, they collect the following data:
| light type | healthy | unhealthy | total |
|---|---|---|---|
| led light | 12 | 8 | 20 |
| fluorescent light | 8 | 12 | 20 |
| total | 40 | 30 | 70 |
researchers aim to determine whether the type of light has a significant effect on plant growth. to evaluate this, perform a chi-squared test for independence using r. you can use the following r code to input the data as a matrix:
obs_mat <- matrix(c(20, 10, 12, 8, 8, 12), nrow=3, byrow=t)
use the r output from the chi-squared test for independence to determine the following results.
test statistic: (round your answer to 4 decimal places)
p-value: (round your answer to 4 decimal places)
🆕 New Concept Discovered: Chi-Squared Test for Independence
Testing relationship between two categorical variables
Step 1: Calculate Expected Frequencies
To perform a chi-squared test for independence, we first calculate the expected frequency for each cell in the contingency table using the formula:
Given the observed table:
- Row 1 (Natural Sunlight): Total = \(30\)
- Row 2 (LED Light): Total = \(20\)
- Row 3 (Fluorescent Light): Total = \(20\)
- Column 1 (Healthy): Total = \(40\)
- Column 2 (Unhealthy): Total = \(30\)
- Grand Total (\(N\)): \(70\)
Let's calculate the expected values (\(E\)):
- Natural Sunlight & Healthy:
- Natural Sunlight & Unhealthy:
- LED Light & Healthy:
- LED Light & Unhealthy:
- Fluorescent Light & Healthy:
- Fluorescent Light & Unhealthy:
---
Step 2: Compute the Chi-Squared Test Statistic
The test statistic \(\chi^2\) is calculated using:
Let's compute the term \(\frac{(O - E)^2}{E}\) for each of the 6 cells:
- Natural Sunlight & Healthy:
- Natural Sunlight & Unhealthy:
- LED Light & Healthy:
- LED Light & Unhealthy:
- Fluorescent Light & Healthy:
- Fluorescent Light & Unhealthy:
Summing these values gives the test statistic:
Rounding to 4 decimal places:
---
Step 3: Determine the Degrees of Freedom and p-value
The degrees of freedom (\(df\)) for a contingency table with \(r\) rows and \(c\) columns is:
Using a Chi-squared distribution with \(2\) degrees of freedom, we find the probability of obtaining a test statistic at least as extreme as \(3.577778\):
Using R or a standard chi-squared distribution calculator:
pchisq(3.577778, df = 2, lower.tail = FALSE)
# Output: 0.167144
Rounding to 4 decimal places:

Snap & solve any problem in the app
Get step-by-step solutions on Sovi AI
Photo-based solutions with guided steps
Explore more problems and detailed explanations
- Test statistic: 3.5778
- p-value: 0.1671