QUESTION IMAGE
Question
question 12 (multiple choice worth 1 points)
(linear functions fit to data lc)
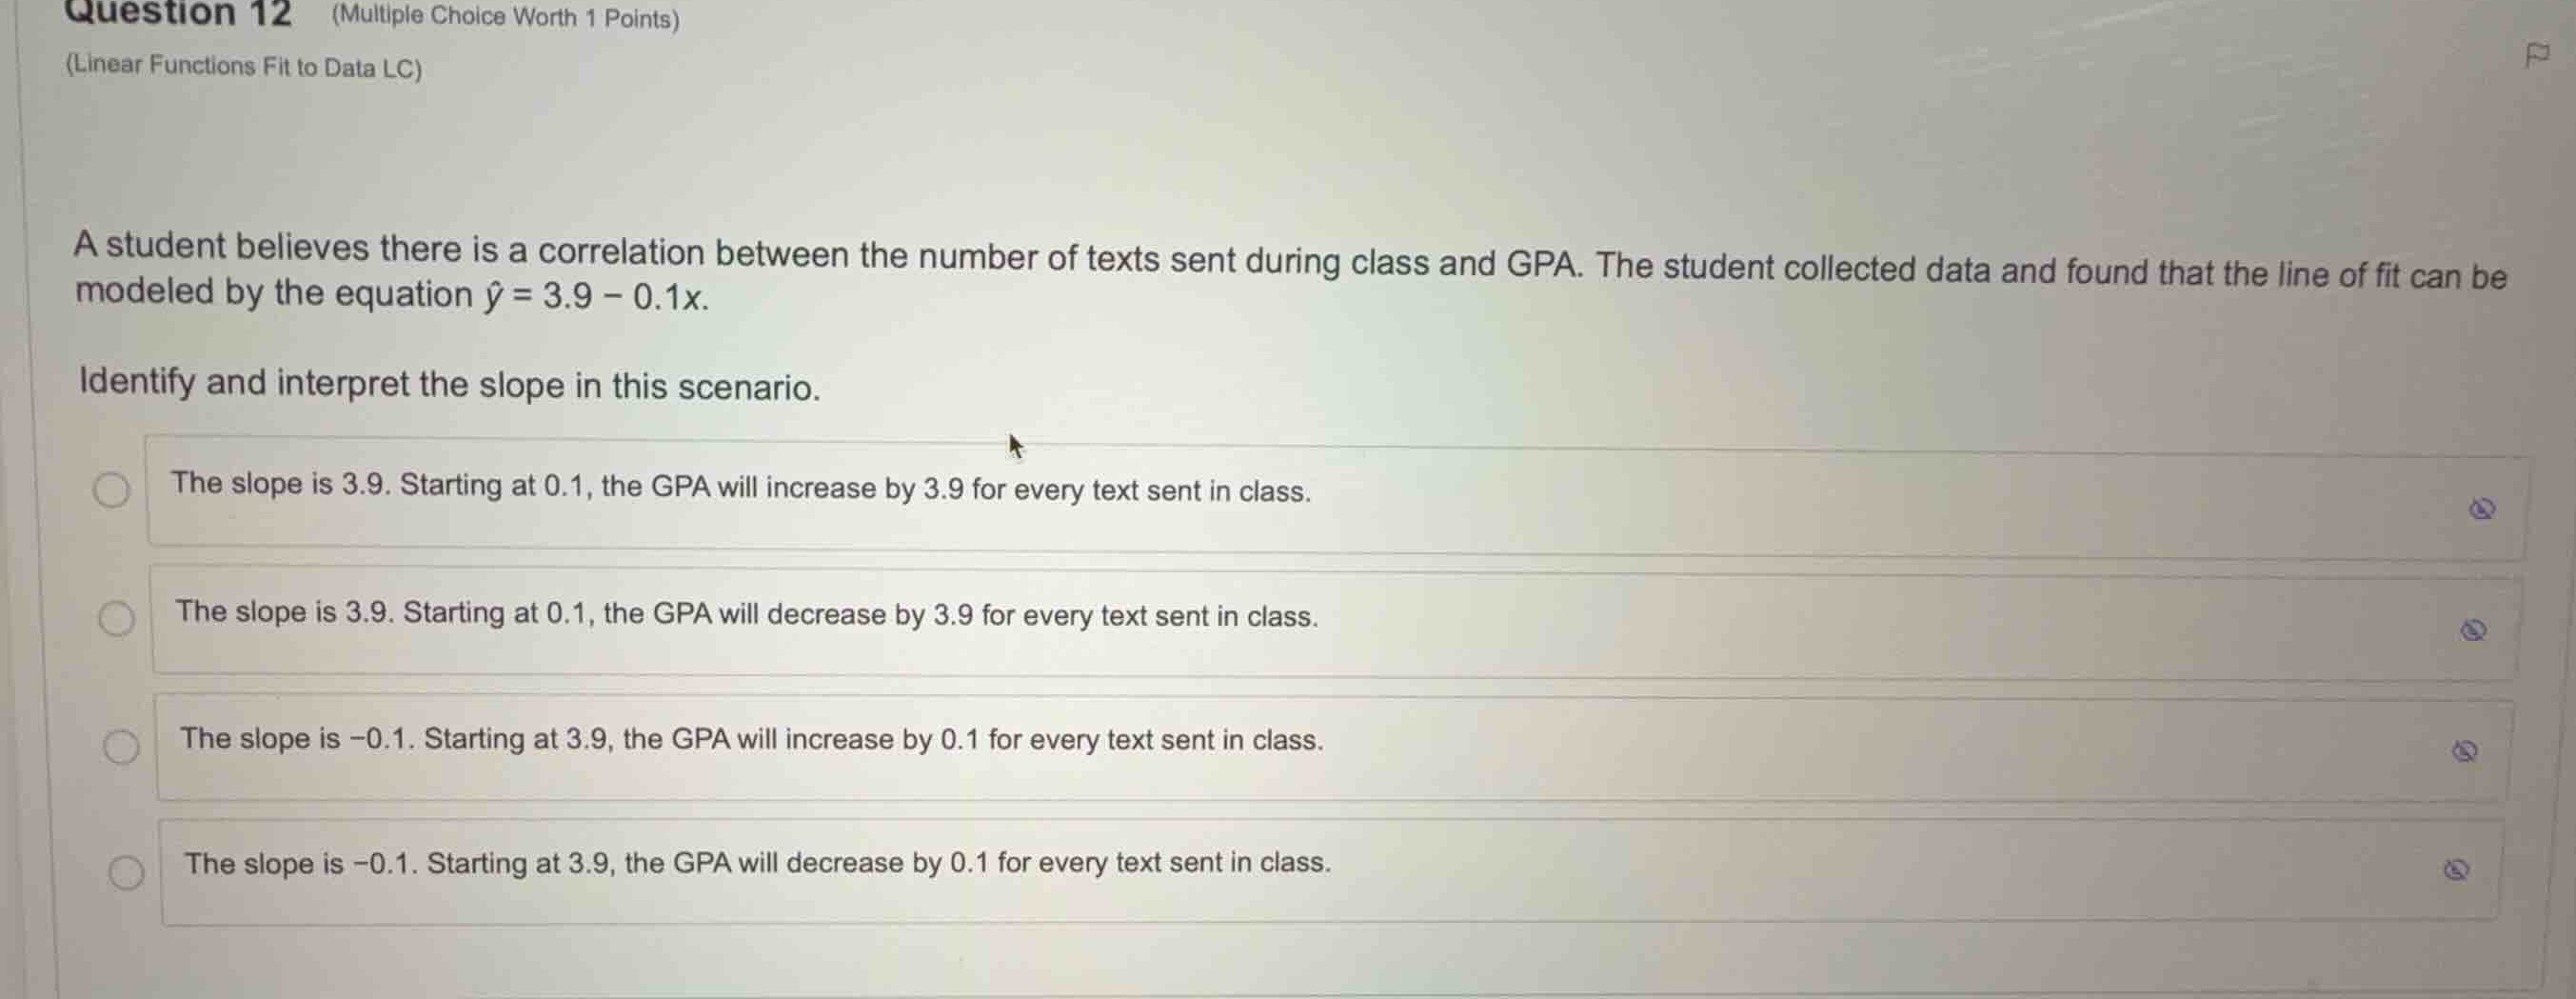
a student believes there is a correlation between the number of texts sent during class and gpa. the student collected data and found that the line of fit can be modeled by the equation \\(\hat{y} = 3.9 - 0.1x\\).
identify and interpret the slope in this scenario.
- the slope is 3.9. starting at 0.1, the gpa will increase by 3.9 for every text sent in class.
- the slope is 3.9. starting at 0.1, the gpa will decrease by 3.9 for every text sent in class.
- the slope is -0.1. starting at 3.9, the gpa will increase by 0.1 for every text sent in class.
- the slope is -0.1. starting at 3.9, the gpa will decrease by 0.1 for every text sent in class.
Identify the slope and y-intercept
$$
LATEXBLOCK0
$$
Interpret the parameters
$$
LATEXBLOCK1
$$
Match with options
$$
\text{Option 4: Slope is } -0.1\text{, starting at } 3.9\text{, GPA decreases by } 0.1\text{ per text.}
$$

Snap & solve any problem in the app
Get step-by-step solutions on Sovi AI
Photo-based solutions with guided steps
Explore more problems and detailed explanations
- (A) The slope is 3.9. Starting at 0.1, the GPA will increase by 3.9 for every text sent in class.
- (B) The slope is 3.9. Starting at 0.1, the GPA will decrease by 3.9 for every text sent in class.
- (C) The slope is -0.1. Starting at 3.9, the GPA will increase by 0.1 for every text sent in class.
- (D) The slope is -0.1. Starting at 3.9, the GPA will decrease by 0.1 for every text sent in class. (Correct answer)