QUESTION IMAGE
Question
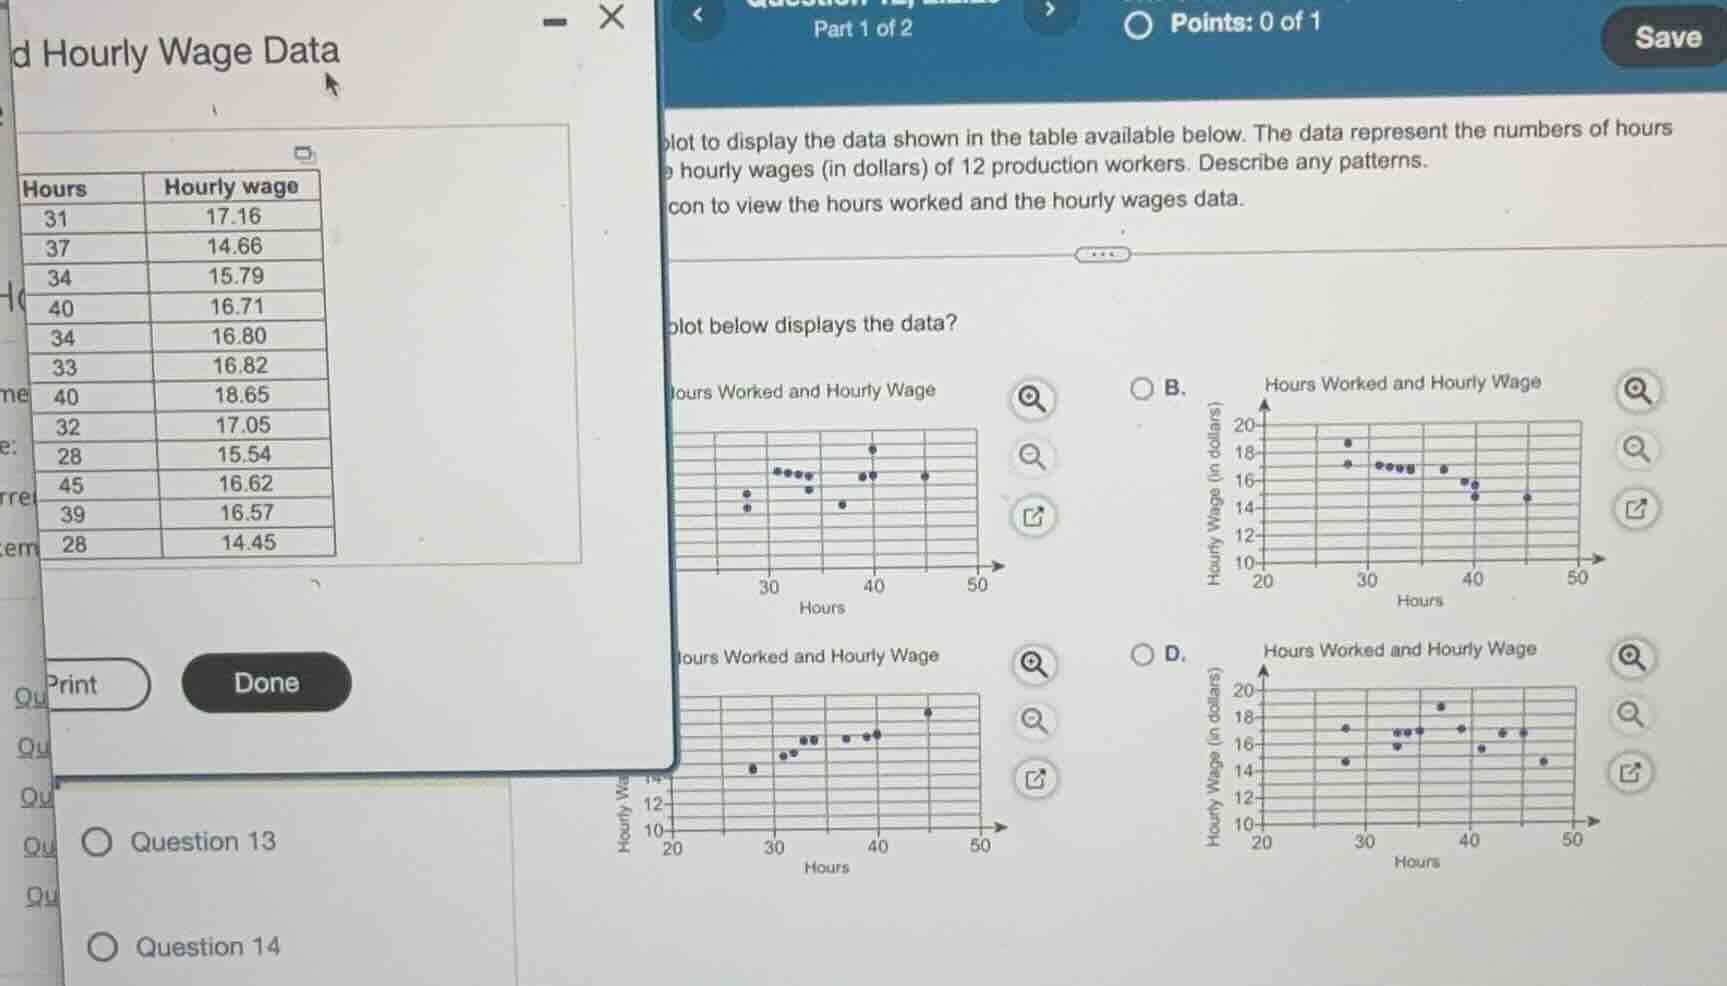
plot to display the data shown in the table available below. the data represent the numbers of hours and hourly wages (in dollars) of 12 production workers. describe any patterns.
hours worked and hourly wage data
\
$$\begin{tabular}{|c|c|}
\\hline
hours & hourly wage \\\\
\\hline
31 & 17.16 \\\\
\\hline
37 & 14.66 \\\\
\\hline
34 & 15.79 \\\\
\\hline
40 & 16.71 \\\\
\\hline
34 & 16.80 \\\\
\\hline
33 & 16.82 \\\\
\\hline
40 & 18.65 \\\\
\\hline
32 & 17.05 \\\\
\\hline
28 & 15.54 \\\\
\\hline
45 & 16.62 \\\\
\\hline
39 & 16.57 \\\\
\\hline
28 & 14.45 \\\\
\\hline
\\end{tabular}$$
which plot below displays the data?
Identify key data points to distinguish the plots
We examine specific coordinates \((x, y) = (\text{Hours}, \text{Hourly wage})\) from the data table:
- Point 1: \((31, 17.16)\)
- Point 2: \((37, 14.66)\)
- Point 3: \((34, 15.79)\)
- Point 4: \((40, 16.71)\)
- Point 5: \((34, 16.80)\)
- Point 6: \((33, 16.82)\)
- Point 7: \((40, 18.65)\)
- Point 8: \((32, 17.05)\)
- Point 9: \((28, 15.54)\)
- Point 10: \((45, 16.62)\)
- Point 11: \((39, 16.57)\)
- Point 12: \((28, 14.45)\)
Check coordinates on the candidate plots
- For \(x = 28\), we must have two points at \(y = 14.45\) and \(y = 15.54\).
- For \(x = 40\), we must have two points at \(y = 16.71\) and \(y = 18.65\).
- For \(x = 45\), we must have one point at \(y = 16.62\).
Compare with the options
- Option A: At \(x = 40\), there is a point near \(y = 18.65\) and another near \(y = 16.71\). At \(x = 45\), there is a point near \(y = 16.62\). At \(x = 28\), there are points at \(y \approx 14.45\) and \(y \approx 15.54\).
- Option B: Shows a downward trend where higher hours have lower wages (e.g., \(x = 45\) is near \(y = 14.7\)), which does not match the data.
- Option C: At \(x = 45\), the point is plotted near \(y = 18.65\), which is incorrect.
- Option D: At \(x = 28\), the points are plotted near \(y = 14.7\) and \(y = 17.2\), which does not match the data.

Snap & solve any problem in the app
Get step-by-step solutions on Sovi AI
Photo-based solutions with guided steps
Explore more problems and detailed explanations
- (A) Scatter plot with points matching the coordinates: (28, 14.45), (28, 15.54), (31, 17.16), (32, 17.05), (33, 16.82), (34, 15.79), (34, 16.80), (37, 14.66), (39, 16.57), (40, 16.71), (40, 18.65), (45, 16.62) (Correct answer)
- (B) Scatter plot showing a downward trend
- (C) Scatter plot with incorrect high values at 45 hours
- (D) Scatter plot with incorrect values at 28 hours