QUESTION IMAGE
Question
part b
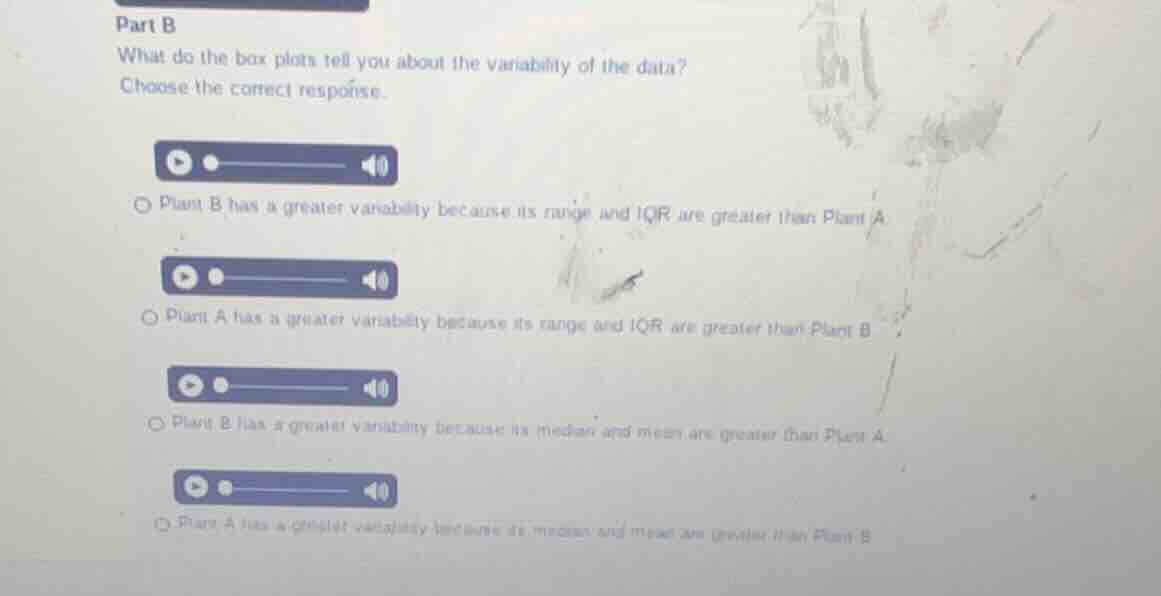
what do the box plots tell you about the variability of the data?
choose the correct response.
plant b has a greater variability because its range and iqr are greater than plant a.
plant a has a greater variability because its range and iqr are greater than plant b.
plant b has a greater variability because its median and mean are greater than plant a.
plant a has a greater variability because its median and mean are greater than plant b.
Analyze measures of variability in box plots
$$
\text{Variability} \implies \text{Range and Interquartile Range (IQR)}
$$
Evaluate the given options
$$
LATEXBLOCK0
$$
Determine the correct choice
$$
\text{Correct Option} = \text{Option 2 (Plant A has a greater variability because its range and IQR are greater than Plant B)}
$$

Snap & solve any problem in the app
Get step-by-step solutions on Sovi AI
Photo-based solutions with guided steps
Explore more problems and detailed explanations
- Plant B has a greater variability because its range and IQR are greater than Plant A
- Plant A has a greater variability because its range and IQR are greater than Plant B (Correct answer)
- Plant B has a greater variability because its median and mean are greater than Plant A
- Plant A has a greater variability because its median and mean are greater than Plant B