QUESTION IMAGE
Question
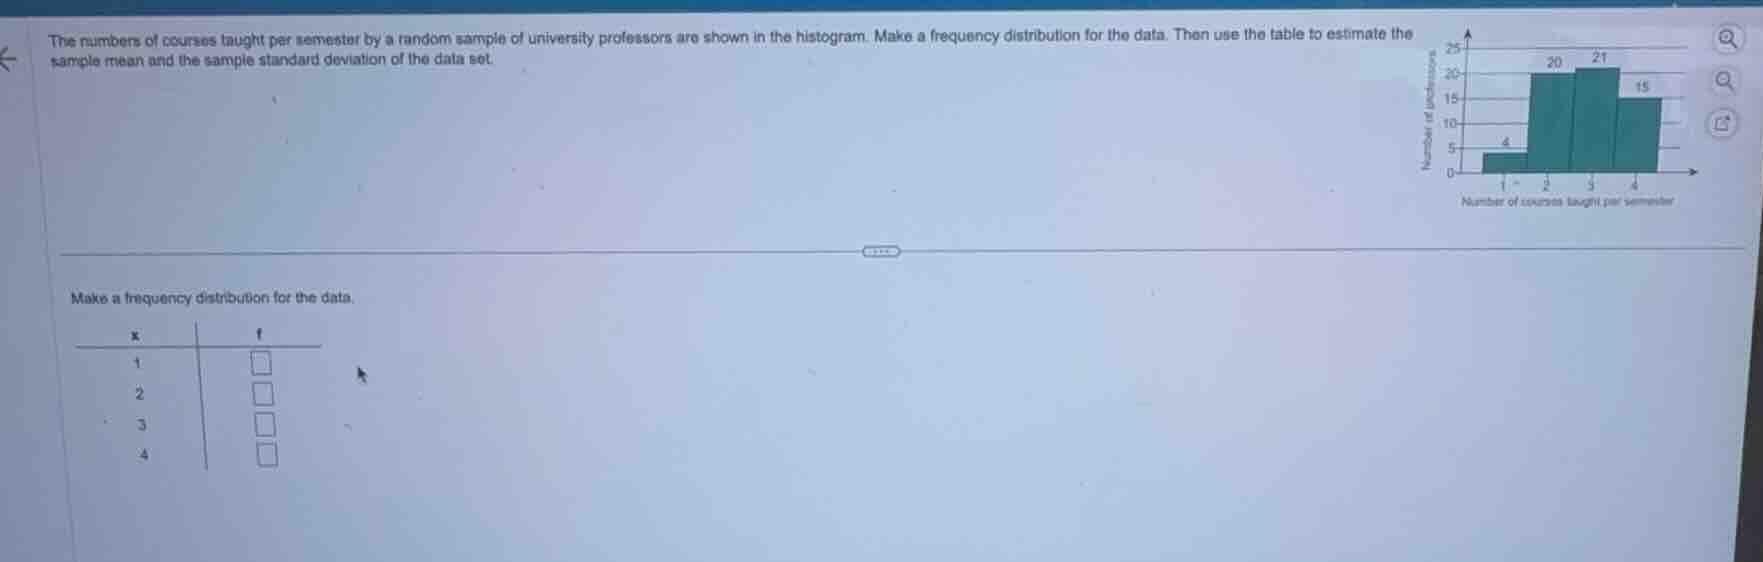
the numbers of courses taught per semester by a random sample of university professors are shown in the histogram. make a frequency distribution for the data. then use the table to estimate the sample mean and the sample standard deviation of the data set.
make a frequency distribution for the data.
\
$$\begin{array}{c|c}
x & f \\\\
\\hline
1 & \\square \\\\
2 & \\square \\\\
3 & \\square \\\\
4 & \\square
\\end{array}$$
Extract frequencies from the histogram
Using the Frequency Distribution knowledge point
$$
LATEXBLOCK0
$$

Snap & solve any problem in the app
Get step-by-step solutions on Sovi AI
Photo-based solutions with guided steps
Explore more problems and detailed explanations
Make a frequency distribution for the data.
| \(x\) | \(f\) |
|---|---|
| 2 | <blank>20</blank> |
| 3 | <blank>21</blank> |
| 4 | <blank>15</blank> |