QUESTION IMAGE
Question
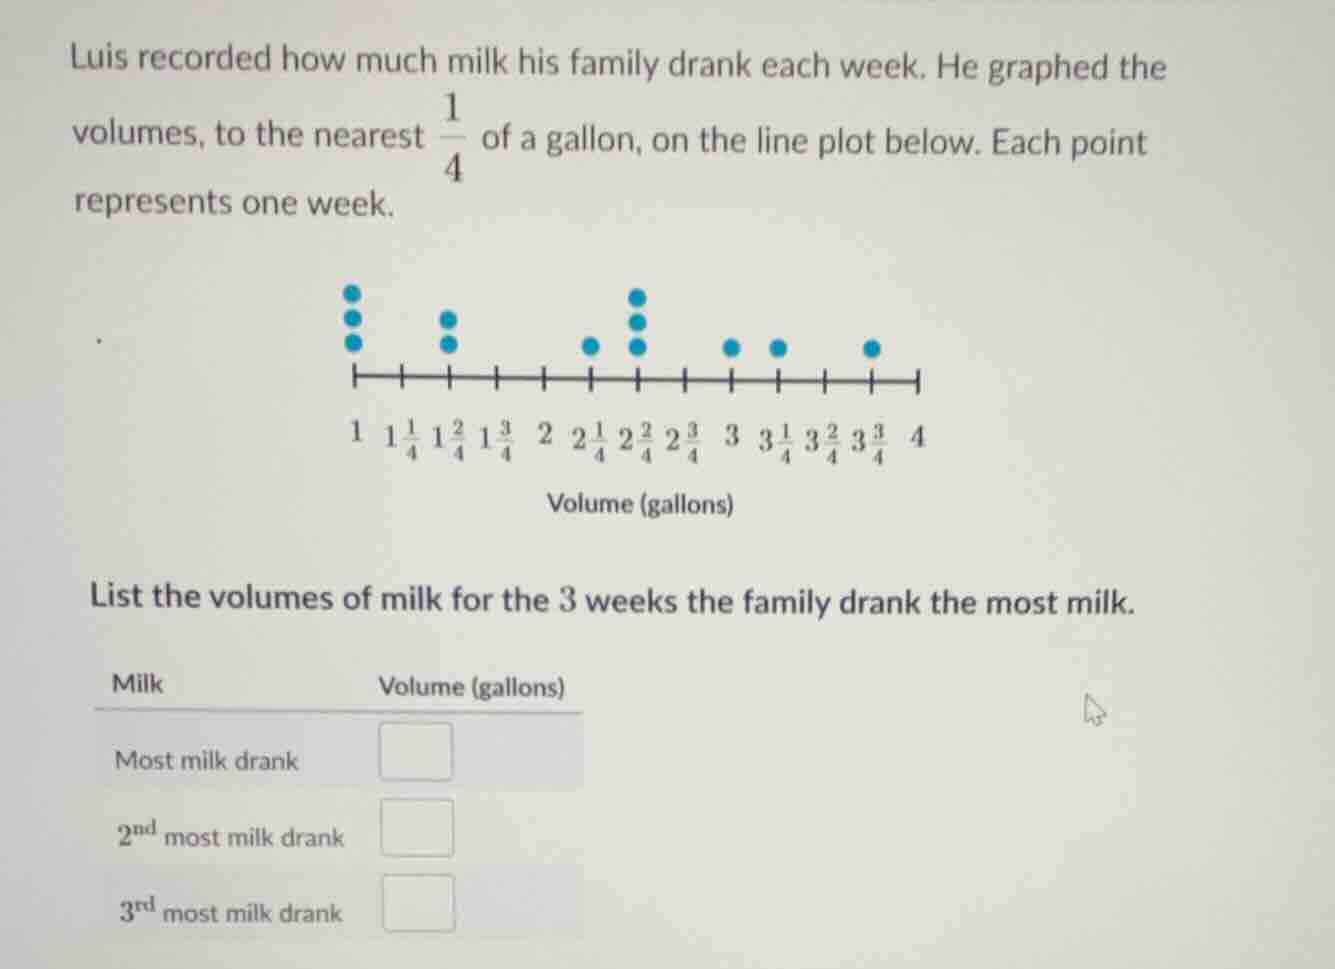
luis recorded how much milk his family drank each week. he graphed the volumes, to the nearest \\(\frac{1}{4}\\) of a gallon, on the line plot below. each point represents one week.
list the volumes of milk for the 3 weeks the family drank the most milk.
milk | volume (gallons)
most milk drank |
\\(2^{\text{nd}}\\) most milk drank |
\\(3^{\text{rd}}\\) most milk drank |
Identify the data points from the line plot
$$
\text{Data points from right to left (largest to smallest): } 3\frac{3}{4}, 3\frac{1}{4}, 3, 2\frac{2}{4}, 2\frac{2}{4}, 2\frac{2}{4}, 2\frac{1}{4}, 1\frac{2}{4}, 1\frac{2}{4}, 1, 1, 1
$$
Determine the three largest values
$$
LATEXBLOCK0
$$

Snap & solve any problem in the app
Get step-by-step solutions on Sovi AI
Photo-based solutions with guided steps
Explore more problems and detailed explanations
List the volumes of milk for the 3 weeks the family drank the most milk.
- Most milk drank: <blank>\(3\frac{3}{4}\)</blank>
- \(2^{\text{nd}}\) most milk drank: <blank>\(3\frac{1}{4}\)</blank>
- \(3^{\text{rd}}\) most milk drank: <blank>\(3\)</blank>