QUESTION IMAGE
Question
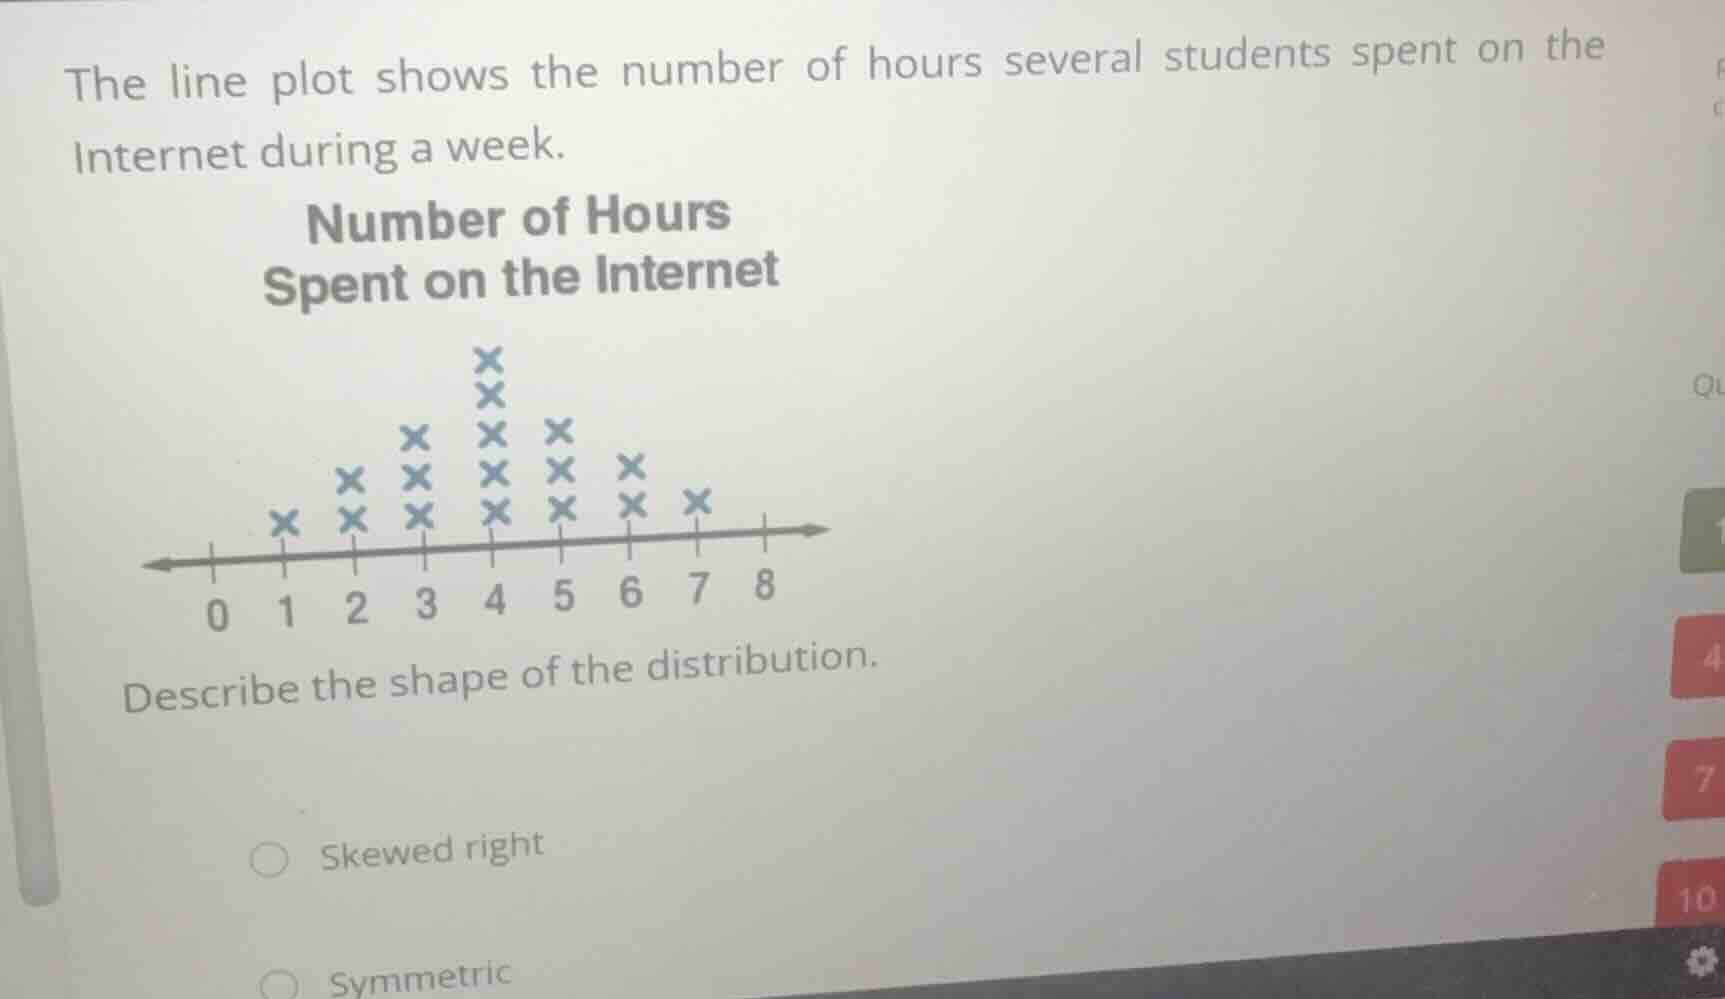
the line plot shows the number of hours several students spent on the internet during a week.
describe the shape of the distribution.
skewed right
symmetric
Identify the data points
Using the Data Distribution Shape knowledge point
We count the number of data points (represented by 'x') at each value on the line plot:
- \(1\): 1
- \(2\): 2
- \(3\): 3
- \(4\): 5
- \(5\): 3
- \(6\): 2
- \(7\): 1
Analyze the symmetry
Using the Data Distribution Shape knowledge point
The peak of the distribution is at \(4\). The counts on either side of the peak are:
- Left side: 3, 2, 1 (at \(3, 2, 1\))
- Right side: 3, 2, 1 (at \(5, 6, 7\))
Since the left and right sides are perfect mirror images of each other, the distribution is symmetric.

Snap & solve any problem in the app
Get step-by-step solutions on Sovi AI
Photo-based solutions with guided steps
Explore more problems and detailed explanations
- Skewed right
- Symmetric (Correct answer)