QUESTION IMAGE
Question
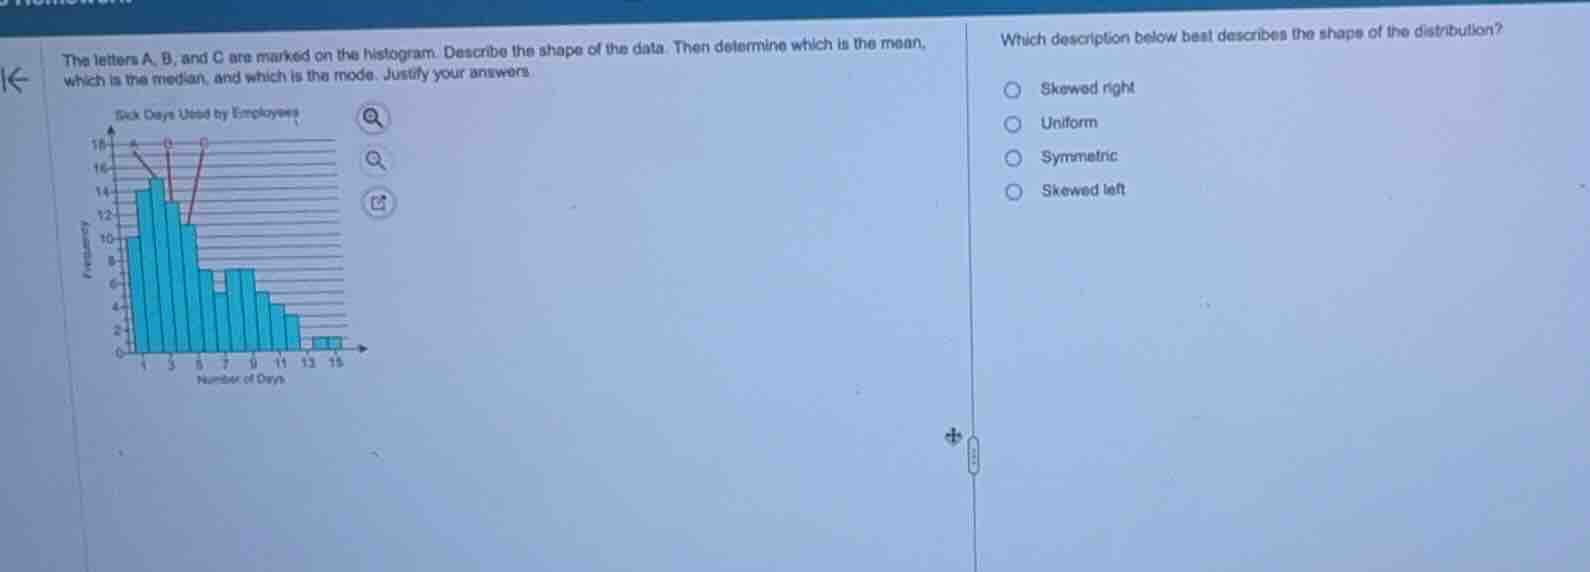
the letters a, b, and c are marked on the histogram. describe the shape of the data. then determine which is the mean, which is the median, and which is the mode. justify your answers.
which description below best describes the shape of the distribution?
skewed right
uniform
symmetric
skewed left
Analyze the histogram shape
Using the Histogram Shape Analysis knowledge point, we observe the distribution of the data in the histogram titled "Sick Days Used by Employees". The highest bars (the peak of the distribution) are located on the left side of the graph, specifically around 2 to 4 days. As we move to the right toward larger values (up to 15 days), the frequencies gradually decrease, creating a long tail that extends to the right.
Determine the skewness
Using the Histogram Shape Analysis knowledge point, when a distribution has a peak on the left and a long tail extending to the right, it is described as skewed right (or positively skewed). This indicates that while most employees use a small number of sick days, a few employees use a much larger number of sick days, pulling the tail to the right.

Snap & solve any problem in the app
Get step-by-step solutions on Sovi AI
Photo-based solutions with guided steps
Explore more problems and detailed explanations
- Skewed right (Correct answer)
- Uniform
- Symmetric
- Skewed left