QUESTION IMAGE
Question
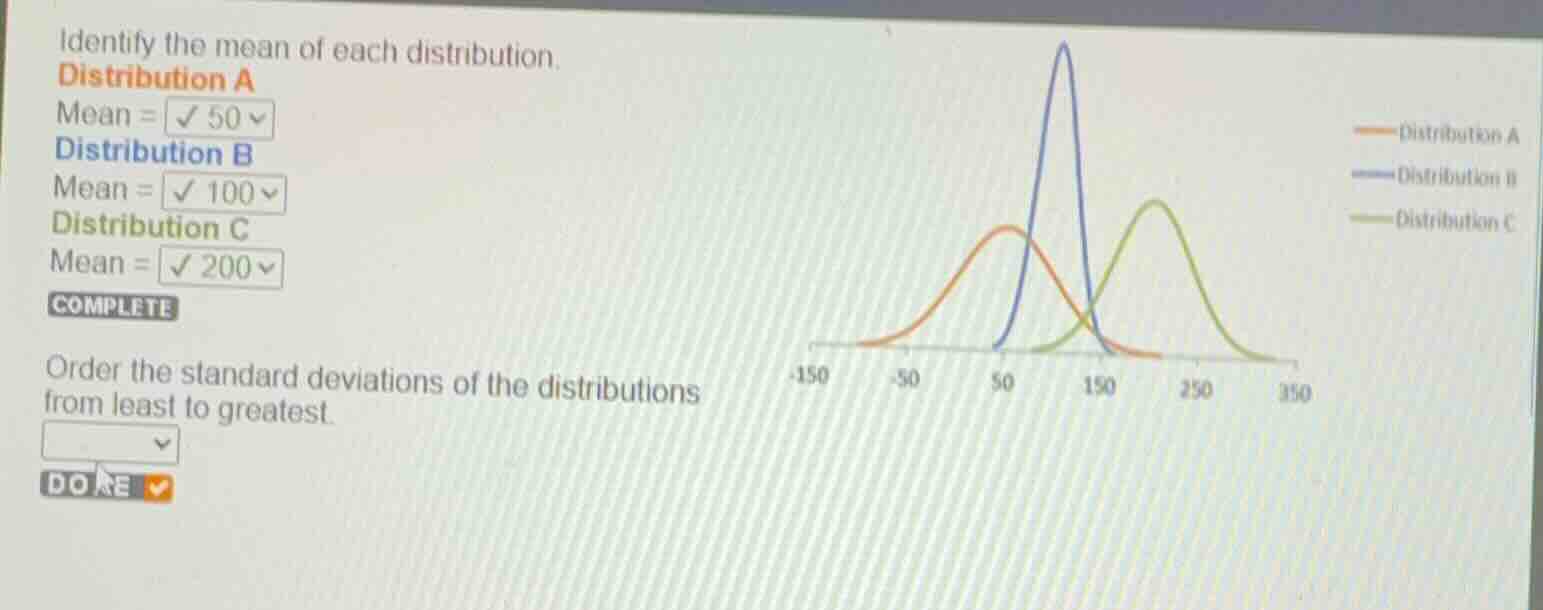
identify the mean of each distribution.
distribution a
mean = 50
distribution b
mean = 100
distribution c
mean = 200
order the standard deviations of the distributions from least to greatest.
Identify the relationship between curve shape and standard deviation
The standard deviation of a normal distribution measures the spread of the data. A curve that is tall and narrow has a smaller standard deviation because the data points are clustered closely around the mean. Conversely, a curve that is short and wide has a larger standard deviation because the data points are more spread out.
Compare the spreads of the three distributions
Looking at the given graph:
- Distribution B (blue curve) is the tallest and narrowest, meaning it has the least spread and therefore the smallest standard deviation.
- Distribution C (green curve) is moderately spread out, wider than B but narrower than A.
- Distribution A (orange curve) is the shortest and widest, meaning it has the greatest spread and therefore the largest standard deviation.
Order the standard deviations from least to greatest
Comparing the spreads directly:
- Least standard deviation: Distribution B
- Middle standard deviation: Distribution C
- Greatest standard deviation: Distribution A
Thus, the correct order from least to greatest is: Distribution B, Distribution C, Distribution A.

Snap & solve any problem in the app
Get step-by-step solutions on Sovi AI
Photo-based solutions with guided steps
Explore more problems and detailed explanations
Order the standard deviations of the distributions from least to greatest.
<blank>Distribution B, Distribution C, Distribution A</blank>