QUESTION IMAGE
Question
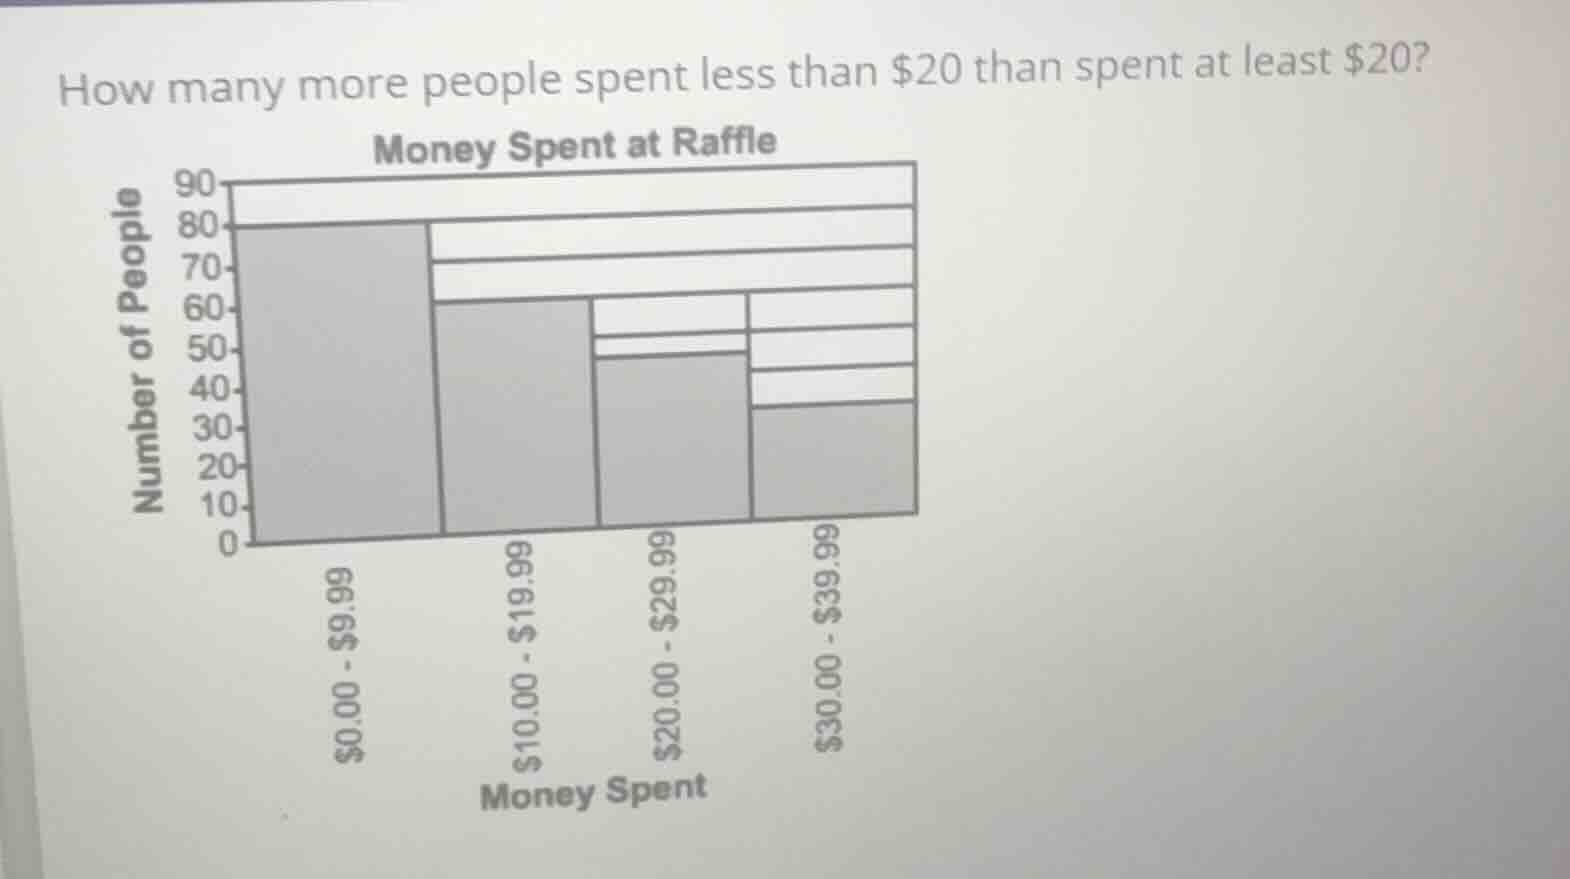
how many more people spent less than $20 than spent at least $20?
Identify the intervals
We need to group the histogram bars into two categories based on the spending threshold of \$20:
- "Less than \$20" consists of the intervals:
- \$0.00 - \$9.99
- \$10.00 - \$19.99
- "At least \$20" consists of the intervals:
- \$20.00 - \$29.99
- \$30.00 - \$39.99
Read values from the histogram
Let's determine the number of people in each interval by reading the height of each bar:
- For \$0.00 - \$9.99: The bar reaches exactly 80.
- For \$10.00 - \$19.99: The bar reaches exactly 60.
- For \$20.00 - \$29.99: The bar reaches exactly 45 (midway between 40 and 50).
- For \$30.00 - \$39.99: The bar reaches exactly 30.
Calculate total for "less than \$20"
Sum the values of the first two intervals:
$$
\text{Less than \$20} = 80 + 60 = 140
$$
Calculate total for "at least \$20"
Sum the values of the remaining two intervals:
$$
\text{At least \$20} = 45 + 30 = 75
$$
Find the difference
Subtract the "at least \$20" group from the "less than \$20" group:
$$
\text{Difference} = 140 - 75 = 65
$$

Snap & solve any problem in the app
Get step-by-step solutions on Sovi AI
Photo-based solutions with guided steps
Explore more problems and detailed explanations
65