QUESTION IMAGE
Question
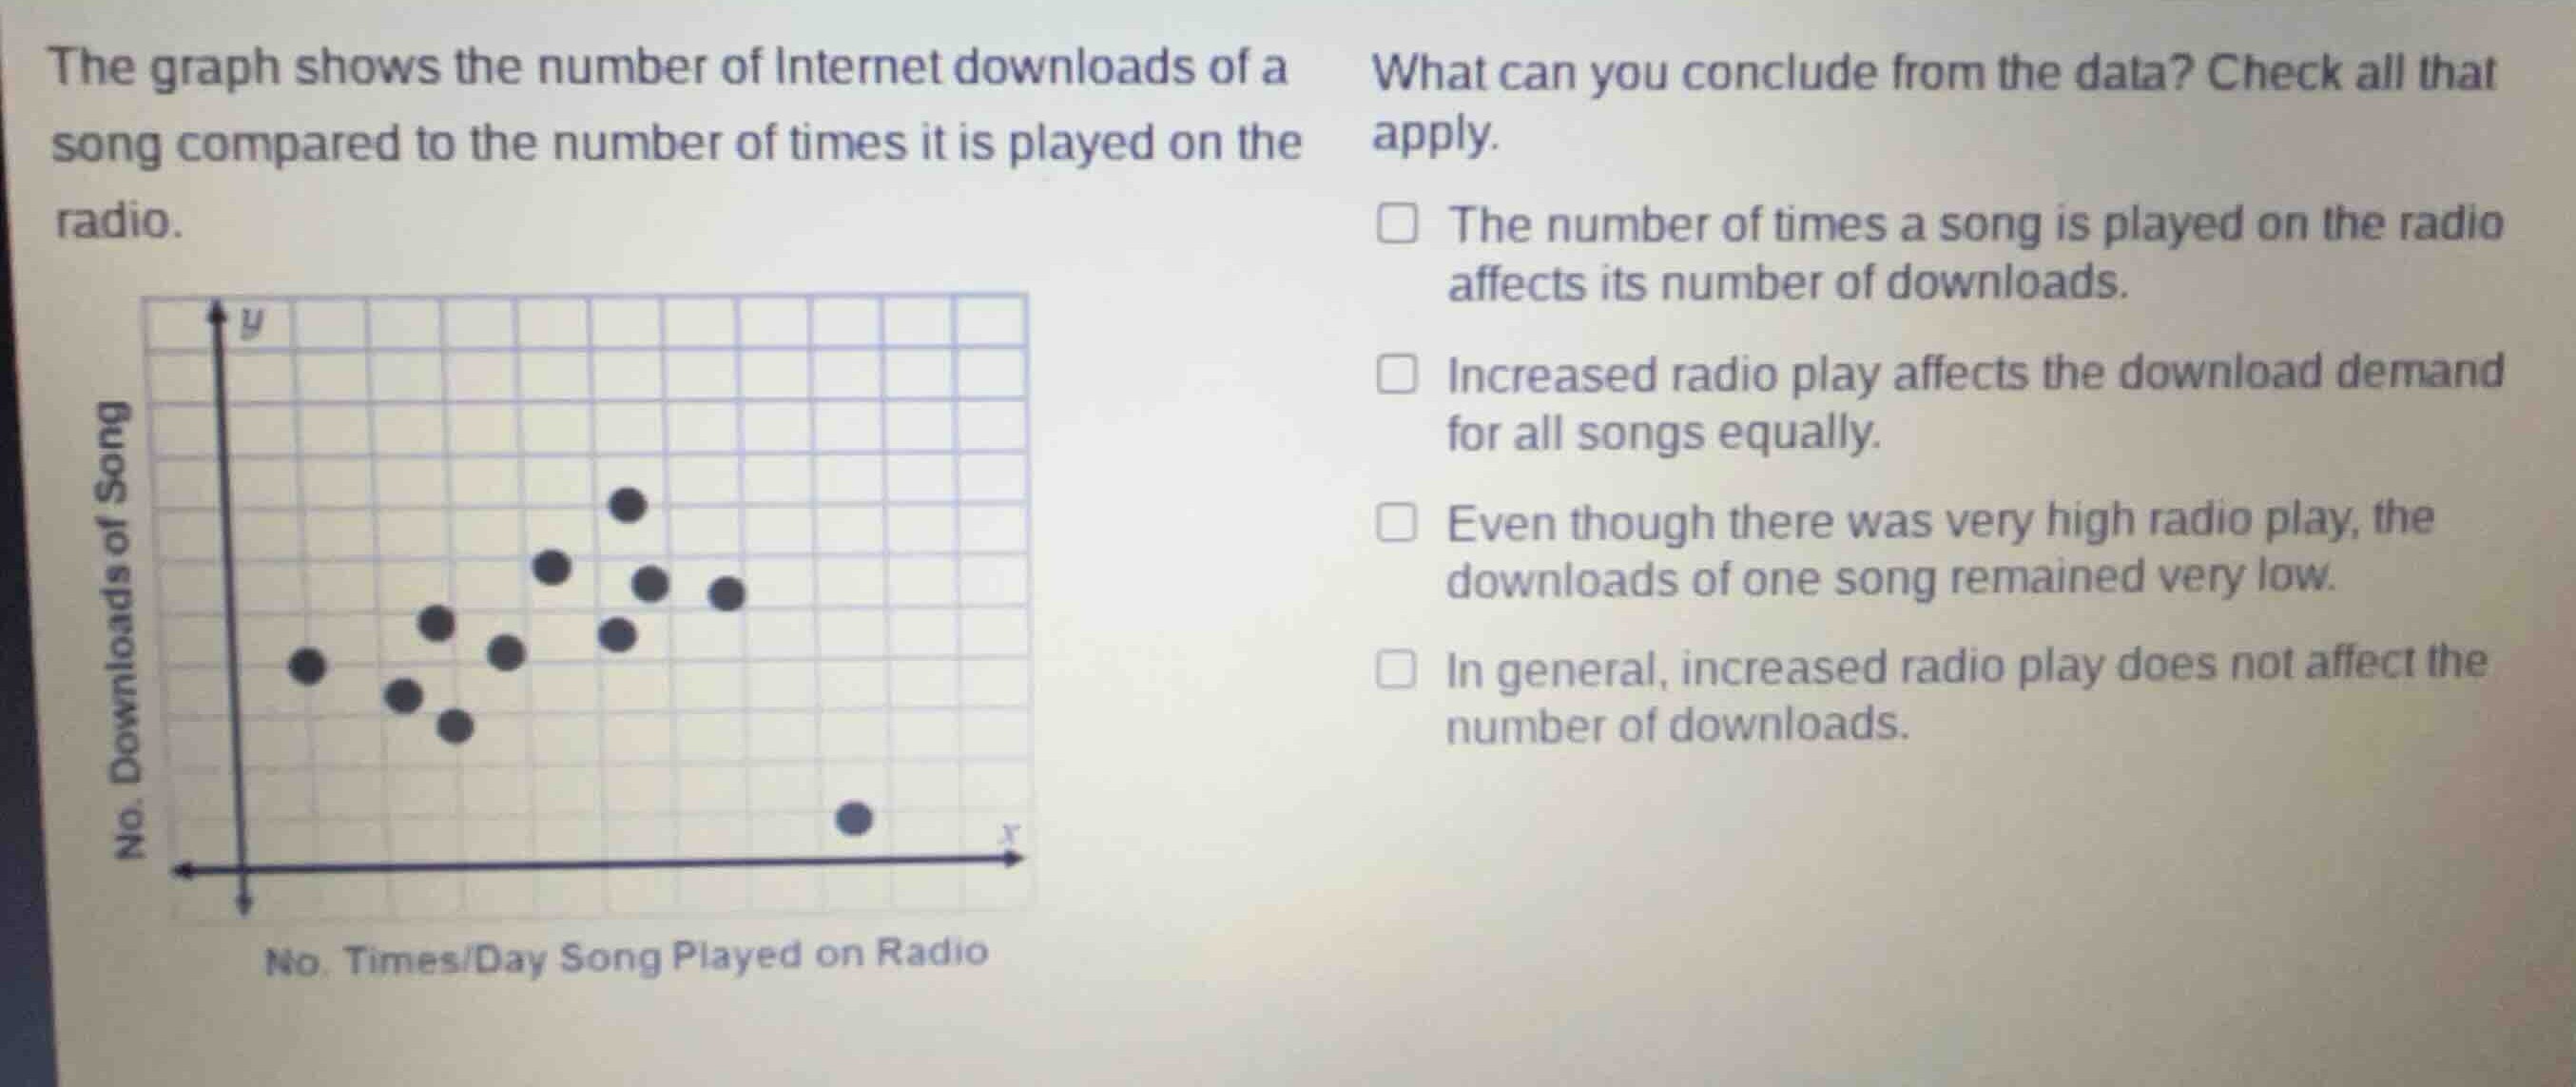
the graph shows the number of internet downloads of a song compared to the number of times it is played on the radio.
what can you conclude from the data? check all that apply.
the number of times a song is played on the radio affects its number of downloads.
increased radio play affects the download demand for all songs equally.
even though there was very high radio play, the downloads of one song remained very low.
in general, increased radio play does not affect the number of downloads.
Analyze the overall trend of the scatterplot
The scatterplot shows a general upward trend where an increase in the number of times a song is played on the radio (x-axis) corresponds to an increase in the number of downloads (y-axis). This indicates that radio play affects the number of downloads.
Evaluate the outliers and variation
The data points do not lie on a perfect line, meaning increased radio play does not affect all songs equally. Additionally, there is a clear outlier at the bottom right: a song with very high radio play but a very low number of downloads.

Snap & solve any problem in the app
Get step-by-step solutions on Sovi AI
Photo-based solutions with guided steps
Explore more problems and detailed explanations
- The number of times a song is played on the radio affects its number of downloads. (Correct answer)
- Increased radio play affects the download demand for all songs equally.
- Even though there was very high radio play, the downloads of one song remained very low. (Correct answer)
- In general, increased radio play does not affect the number of downloads.