QUESTION IMAGE
Question
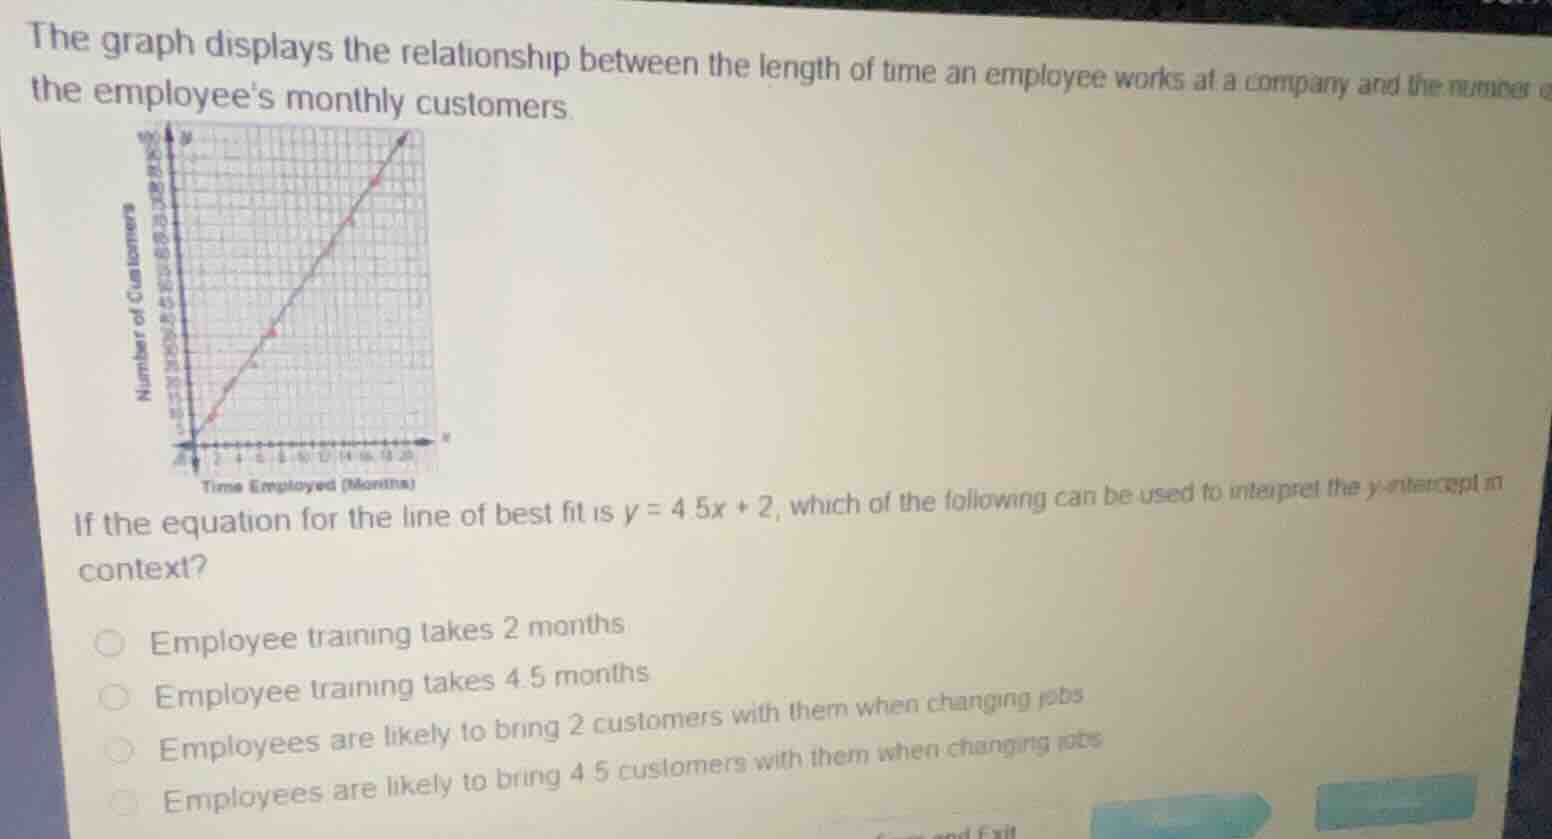
the graph displays the relationship between the length of time an employee works at a company and the number of the employees monthly customers.
if the equation for the line of best fit is \\(y = 4.5x + 2\\), which of the following can be used to interpret the y-intercept in context?
- employee training takes 2 months
- employee training takes 4.5 months
- employees are likely to bring 2 customers with them when changing jobs
- employees are likely to bring 4.5 customers with them when changing jobs
Identify the variables and the y-intercept
$$
LATEXBLOCK0
$$
Interpret the y-intercept in context
$$
LATEXBLOCK1
$$
Match with the correct multiple-choice option
$$
\text{Option 3 matches: "Employees are likely to bring 2 customers with them when changing jobs"}
$$

Snap & solve any problem in the app
Get step-by-step solutions on Sovi AI
Photo-based solutions with guided steps
Explore more problems and detailed explanations
- Employee training takes 2 months
- Employee training takes 4.5 months
- Employees are likely to bring 2 customers with them when changing jobs (Correct answer)
- Employees are likely to bring 4.5 customers with them when changing jobs