QUESTION IMAGE
Question
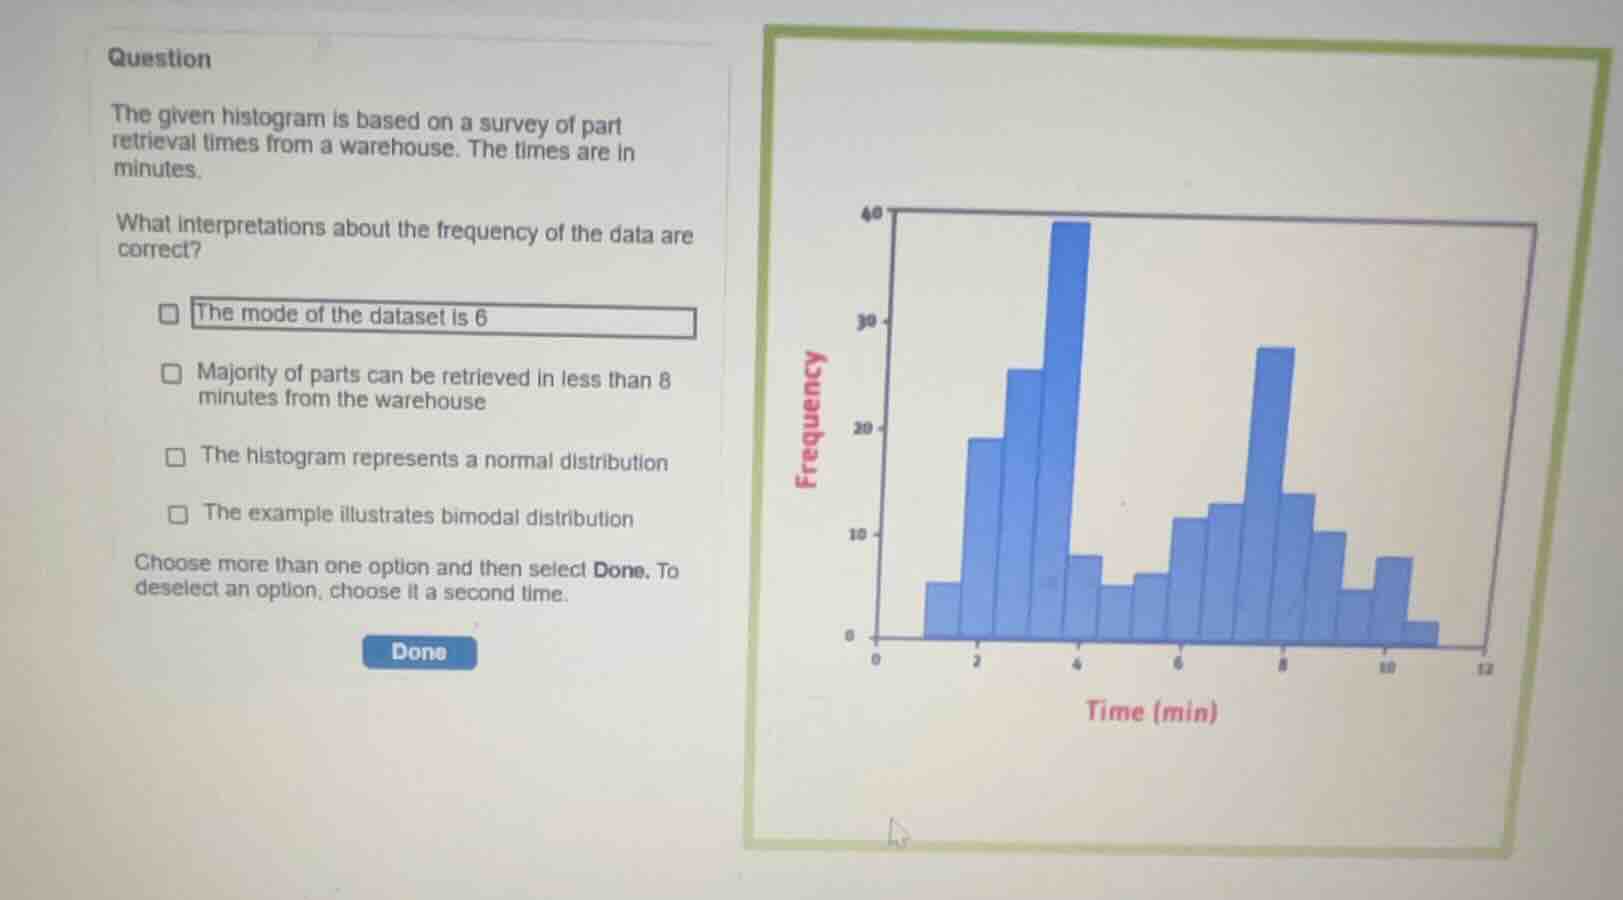
the given histogram is based on a survey of part retrieval times from a warehouse. the times are in minutes.
what interpretations about the frequency of the data are correct?
- the mode of the dataset is 6
- majority of parts can be retrieved in less than 8 minutes from the warehouse
- the histogram represents a normal distribution
- the example illustrates bimodal distribution
choose more than one option and then select done. to deselect an option, choose it a second time.
Analyze the distribution shape
The histogram displays two distinct peaks (local maxima) in frequency: one prominent peak around 3.5 to 4 minutes, and another smaller but distinct peak around 8 minutes. A distribution with two prominent peaks is classified as a bimodal distribution. This directly supports the statement: "The example illustrates bimodal distribution."
Evaluate the normal distribution claim
A normal distribution is characterized by a single, symmetric, bell-shaped curve with one central peak. Because this histogram has two distinct peaks and is asymmetric, it does not represent a normal distribution. Therefore, the statement "The histogram represents a normal distribution" is incorrect.
Evaluate the mode of the dataset
The mode is the value that appears most frequently. Looking at the histogram, the tallest bar (highest frequency, near 40) occurs in the interval between 3 and 4 minutes. The value 6 minutes has a much lower frequency (less than 10). Thus, the mode is not 6, making the statement "The mode of the dataset is 6" incorrect.
Evaluate the majority of parts claim
Let's estimate the frequencies of the bars to determine if the majority of parts are retrieved in less than 8 minutes:
- Bars to the left of 8 minutes (from 1 to 8 minutes):
- [1, 2): ~5
- [2, 2.5): ~19
- [2.5, 3): ~25
- [3, 4): ~39
- [4, 4.5): ~8
- [4.5, 5): ~5
- [5, 5.5): ~6
- [5.5, 6.5): ~11
- [6.5, 7.5): ~13
- Sum of frequencies below 8 minutes is roughly \(5 + 19 + 25 + 39 + 8 + 5 + 6 + 11 + 13 = 131\).
- Bars at 8 minutes and above (from 8 to 11 minutes):
- [7.5, 8.5): ~28
- [8.5, 9): ~14
- [9, 9.5): ~10
- [9.5, 10): ~5
- [10, 10.5): ~8
- [10.5, 11): ~2
- Sum of frequencies at or above 8 minutes is roughly \(28 + 14 + 10 + 5 + 8 + 2 = 67\).
Since \(131\) is significantly greater than \(67\), the vast majority of the surveyed parts (well over half) are retrieved in less than 8 minutes. This makes the statement "Majority of parts can be retrieved in less than 8 minutes from the warehouse" correct.

Snap & solve any problem in the app
Get step-by-step solutions on Sovi AI
Photo-based solutions with guided steps
Explore more problems and detailed explanations
- The mode of the dataset is 6
- Majority of parts can be retrieved in less than 8 minutes from the warehouse (Correct answer)
- The histogram represents a normal distribution
- The example illustrates bimodal distribution (Correct answer)