QUESTION IMAGE
Question
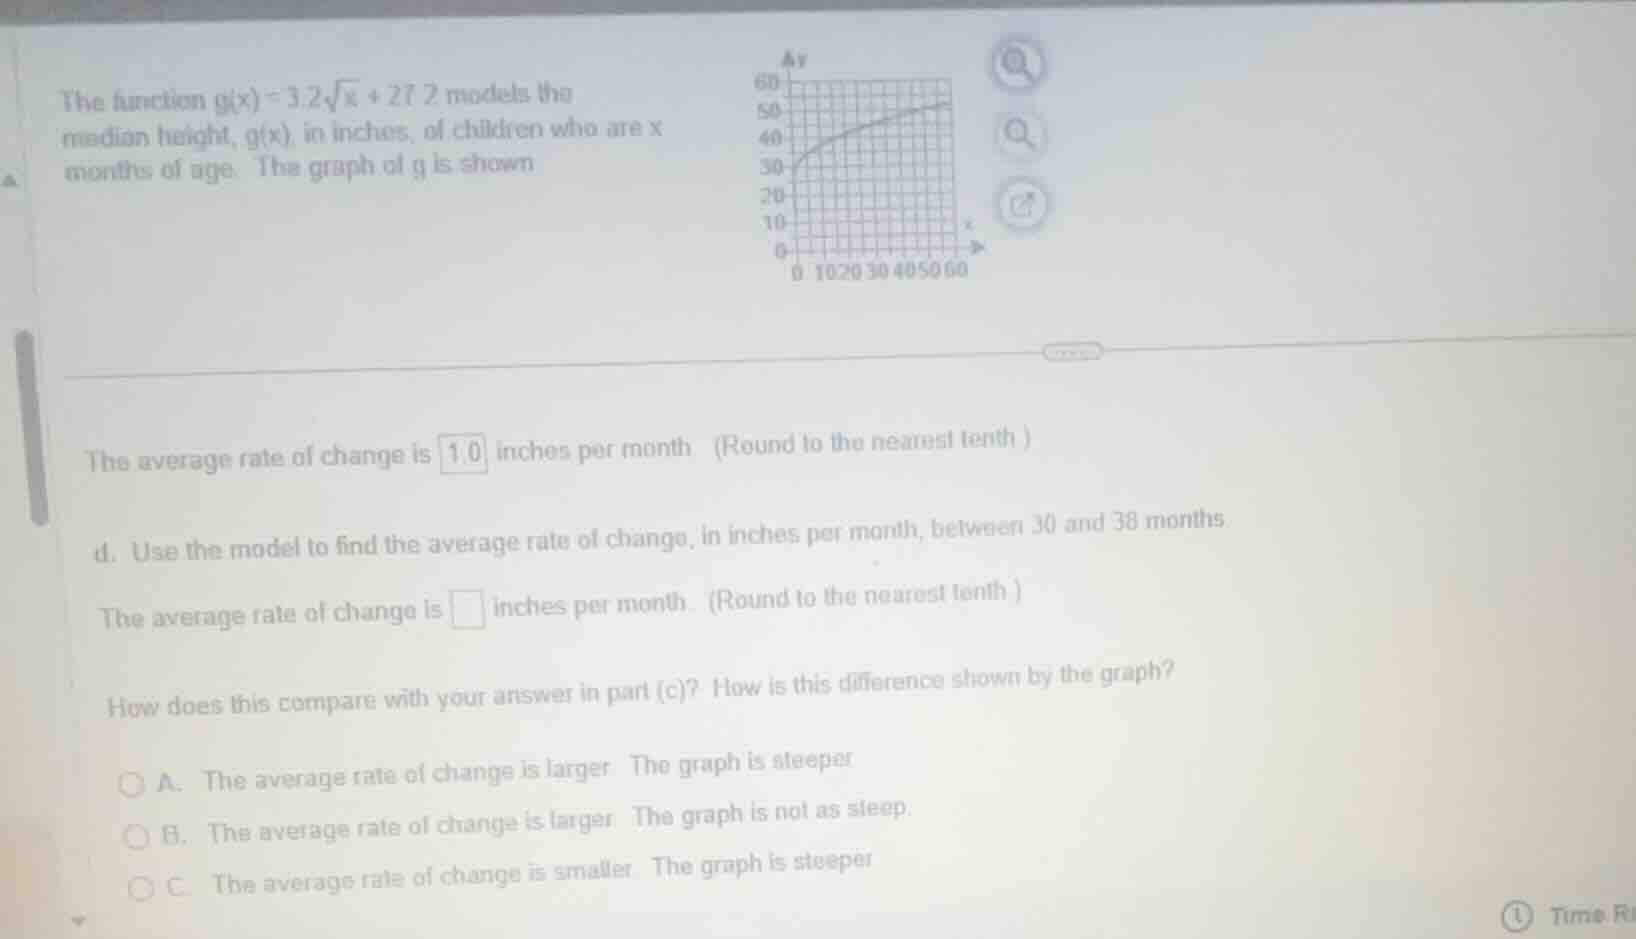
the function \\(g(x) = 3.2\sqrt{x} + 27.2\\) models the median height, \\(g(x)\\), in inches, of children who are \\(x\\) months of age. the graph of \\(g\\) is shown.
the average rate of change is 1.0 inches per month. (round to the nearest tenth)
d. use the model to find the average rate of change, in inches per month, between 30 and 38 months.
the average rate of change is inches per month. (round to the nearest tenth)
how does this compare with your answer in part (c)? how is this difference shown by the graph?
a. the average rate of change is larger. the graph is steeper.
b. the average rate of change is larger. the graph is not as steep.
c. the average rate of change is smaller. the graph is steeper.
Calculate function values at the boundaries
Using the Average Rate of Change knowledge point
Compute the average rate of change
Using the Average Rate of Change knowledge point
Compare with the previous rate of change
We compare the rate of change between \(30\) and \(38\) months (\(0.3\) inches per month) with the previous rate of change between \(0\) and \(10\) months (\(1.0\) inches per month).
- The new average rate of change (\(0.3\)) is smaller than the previous one (\(1.0\)).
- On the graph of a square root function, as \(x\) increases, the curve becomes less steep (flatter). Thus, a smaller rate of change corresponds to a graph that is less steep.

Snap & solve any problem in the app
Get step-by-step solutions on Sovi AI
Photo-based solutions with guided steps
Explore more problems and detailed explanations
Question 1
The average rate of change is <blank>0.3</blank> inches per month.
Question 2
- A. The average rate of change is larger. The graph is steeper.
- B. The average rate of change is larger. The graph is not as steep.
- C. The average rate of change is smaller. The graph is steeper.
- D. The average rate of change is smaller. The graph is not as steep. (Correct answer)