QUESTION IMAGE
Question
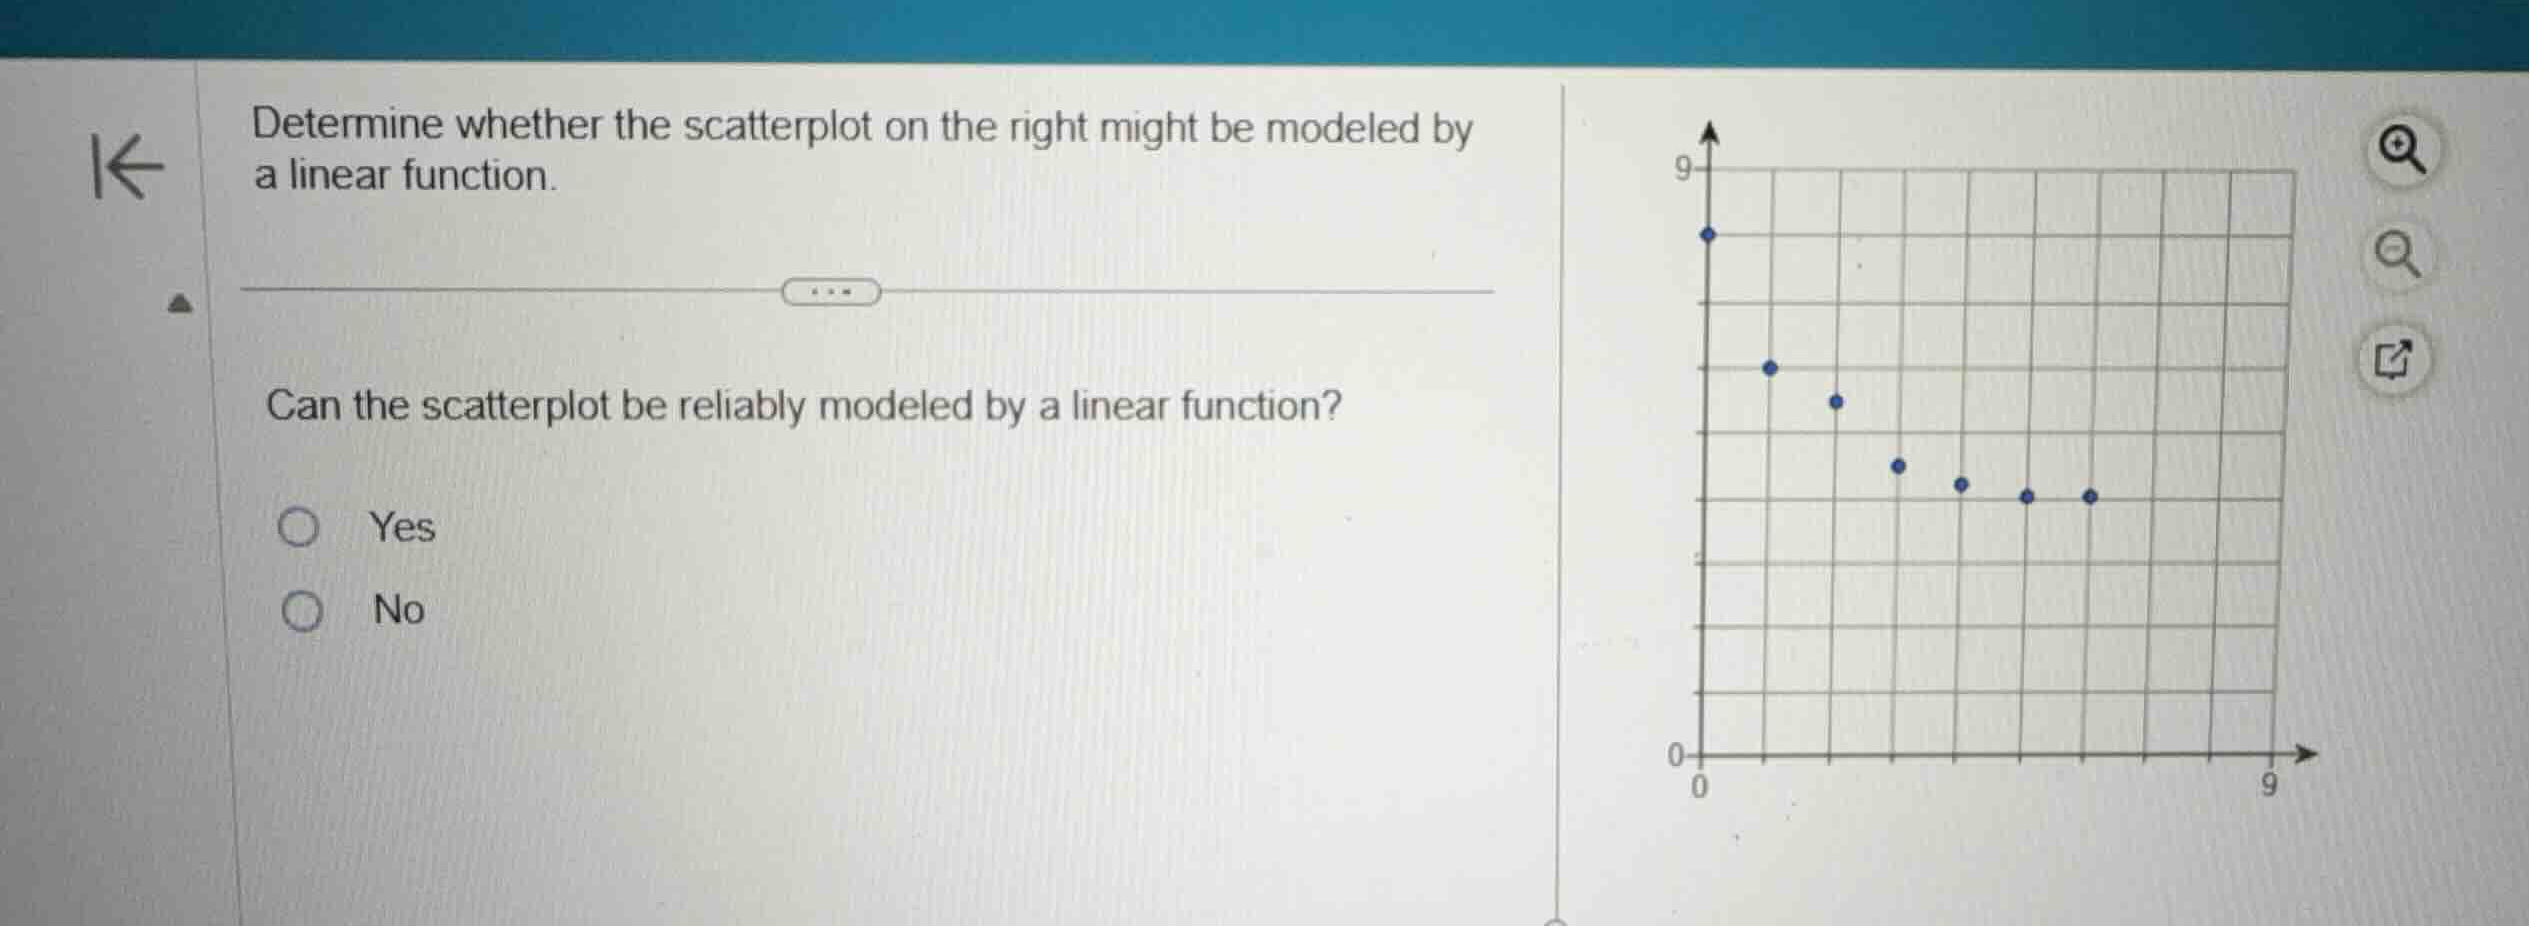
determine whether the scatterplot on the right might be modeled by a linear function.
can the scatterplot be reliably modeled by a linear function?
yes
no
Analyze the scatterplot trend
We observe the pattern of the plotted data points on the coordinate grid. The points start high on the left and decrease rapidly at first, then level off horizontally as they move to the right.
Evaluate linear model suitability
Using the Linear Equations concept, a linear relationship requires a constant rate of change, meaning the points should lie approximately along a straight line.
Compare with non-linear trends
The curve shown in the scatterplot is distinctly bent, resembling an exponential decay or a rational curve rather than a straight line. Therefore, a linear function is not a reliable model.

Snap & solve any problem in the app
Get step-by-step solutions on Sovi AI
Photo-based solutions with guided steps
Explore more problems and detailed explanations
- Yes
- No (Correct answer)