QUESTION IMAGE
Question
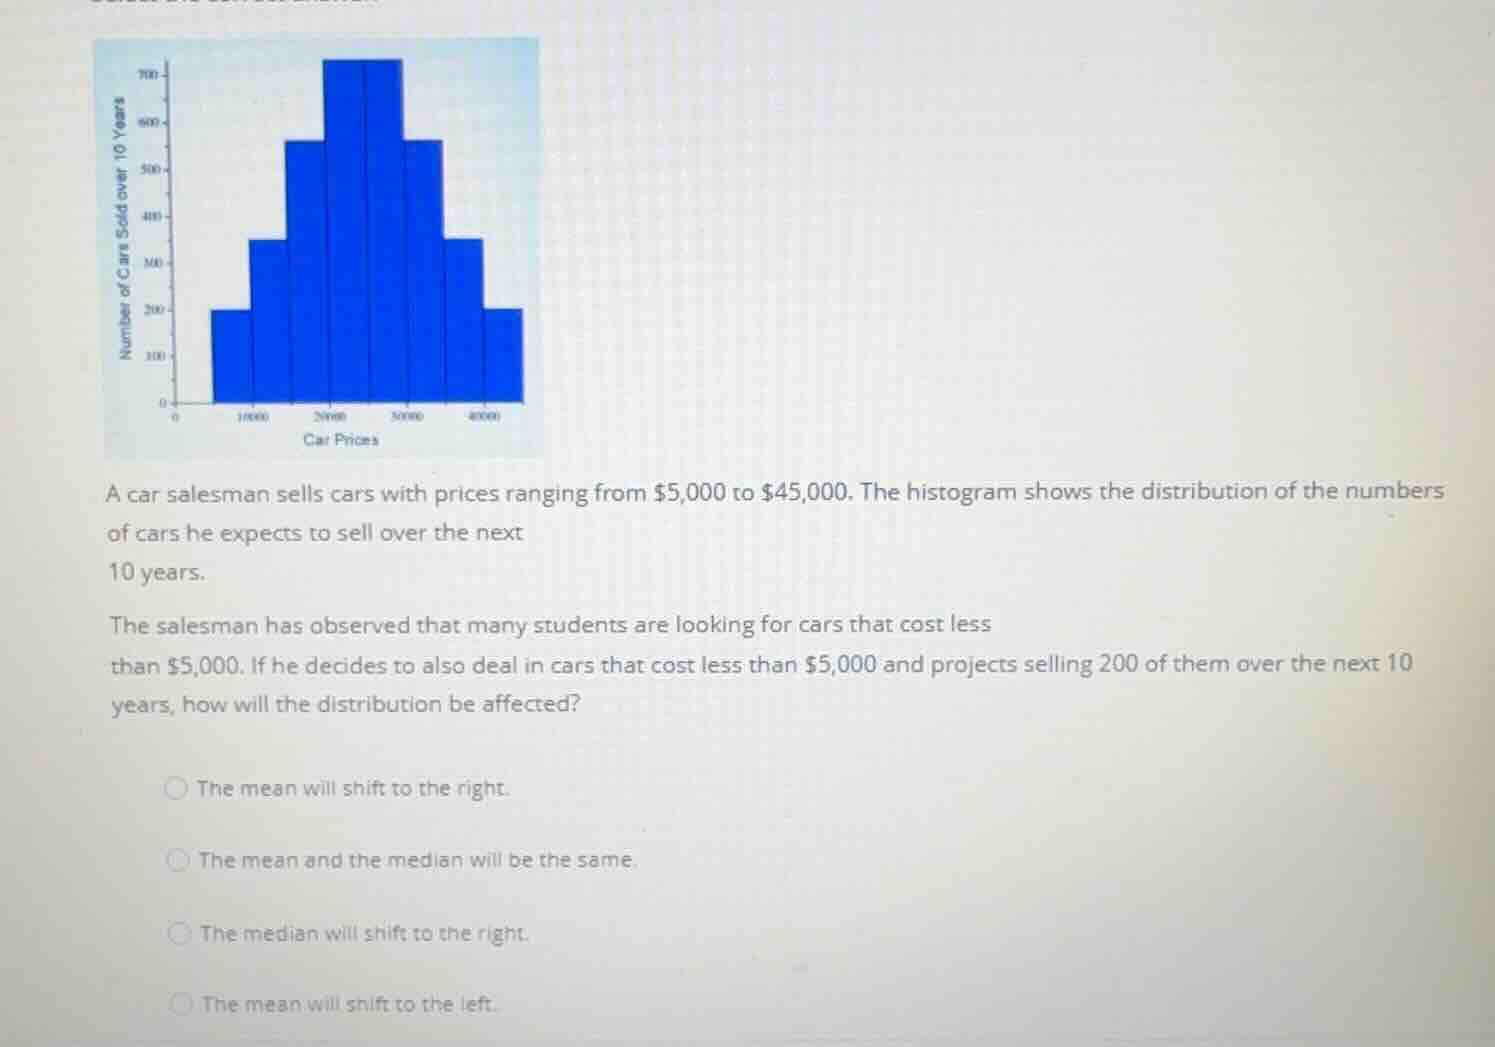
a car salesman sells cars with prices ranging from \\$5,000 to \\$45,000. the histogram shows the distribution of the numbers of cars he expects to sell over the next 10 years.
the salesman has observed that many students are looking for cars that cost less than \\$5,000. if he decides to also deal in cars that cost less than \\$5,000 and projects selling 200 of them over the next 10 years, how will the distribution be affected?
- the mean will shift to the right.
- the mean and the median will be the same.
- the median will shift to the right.
- the mean will shift to the left.
Analyze the initial distribution
The original histogram shows a symmetric distribution of car prices ranging from \$5,000 to \$45,000. For a perfectly symmetric distribution, the mean and the median are located at the center of the distribution (around \$25,000).
Analyze the effect of adding new data
The salesman decides to sell cars that cost less than \$5,000 and projects selling 200 of them. These new data points are located at the extreme left end of the distribution (lower than any existing values).
Determine the shift in the mean
Adding values that are significantly lower than the current average pulls the mean down. Therefore, the mean will decrease, which corresponds to a shift to the left on the horizontal axis.
Determine the shift in the median
While the median might also shift slightly to the left or remain relatively stable due to the large sample size, the most direct and certain statistical effect of adding extremely low values is that the mean will shift to the left. Let's evaluate the given options:
- "The mean will shift to the right": Incorrect, adding low values decreases the mean.
- "The mean and the median will be the same": Incorrect, adding data to only one tail makes the distribution skewed, so they will no longer be equal.
- "The median will shift to the right": Incorrect, adding values on the left cannot shift the median to the right.
- "The mean will shift to the left": Correct, adding lower values pulls the mean to the left.

Snap & solve any problem in the app
Get step-by-step solutions on Sovi AI
Photo-based solutions with guided steps
Explore more problems and detailed explanations
- The mean will shift to the right.
- The mean and the median will be the same.
- The median will shift to the right.
- The mean will shift to the left. (Correct answer)