QUESTION IMAGE
Question
an automotive service company has franchises in two different parts of a city. the number of oil changes made daily, for 25 days, is given below. complete parts a) through f) below.
east store
37 58 27 32 43
20 37 29 25 32
44 29 54 38 54
39 69 37 44 46
15 27 51 42 46
west store
42 43 43 40 34
42 37 39 42 32
39 41 42 36 48
28 30 37 43 33
36 49 31 42 46
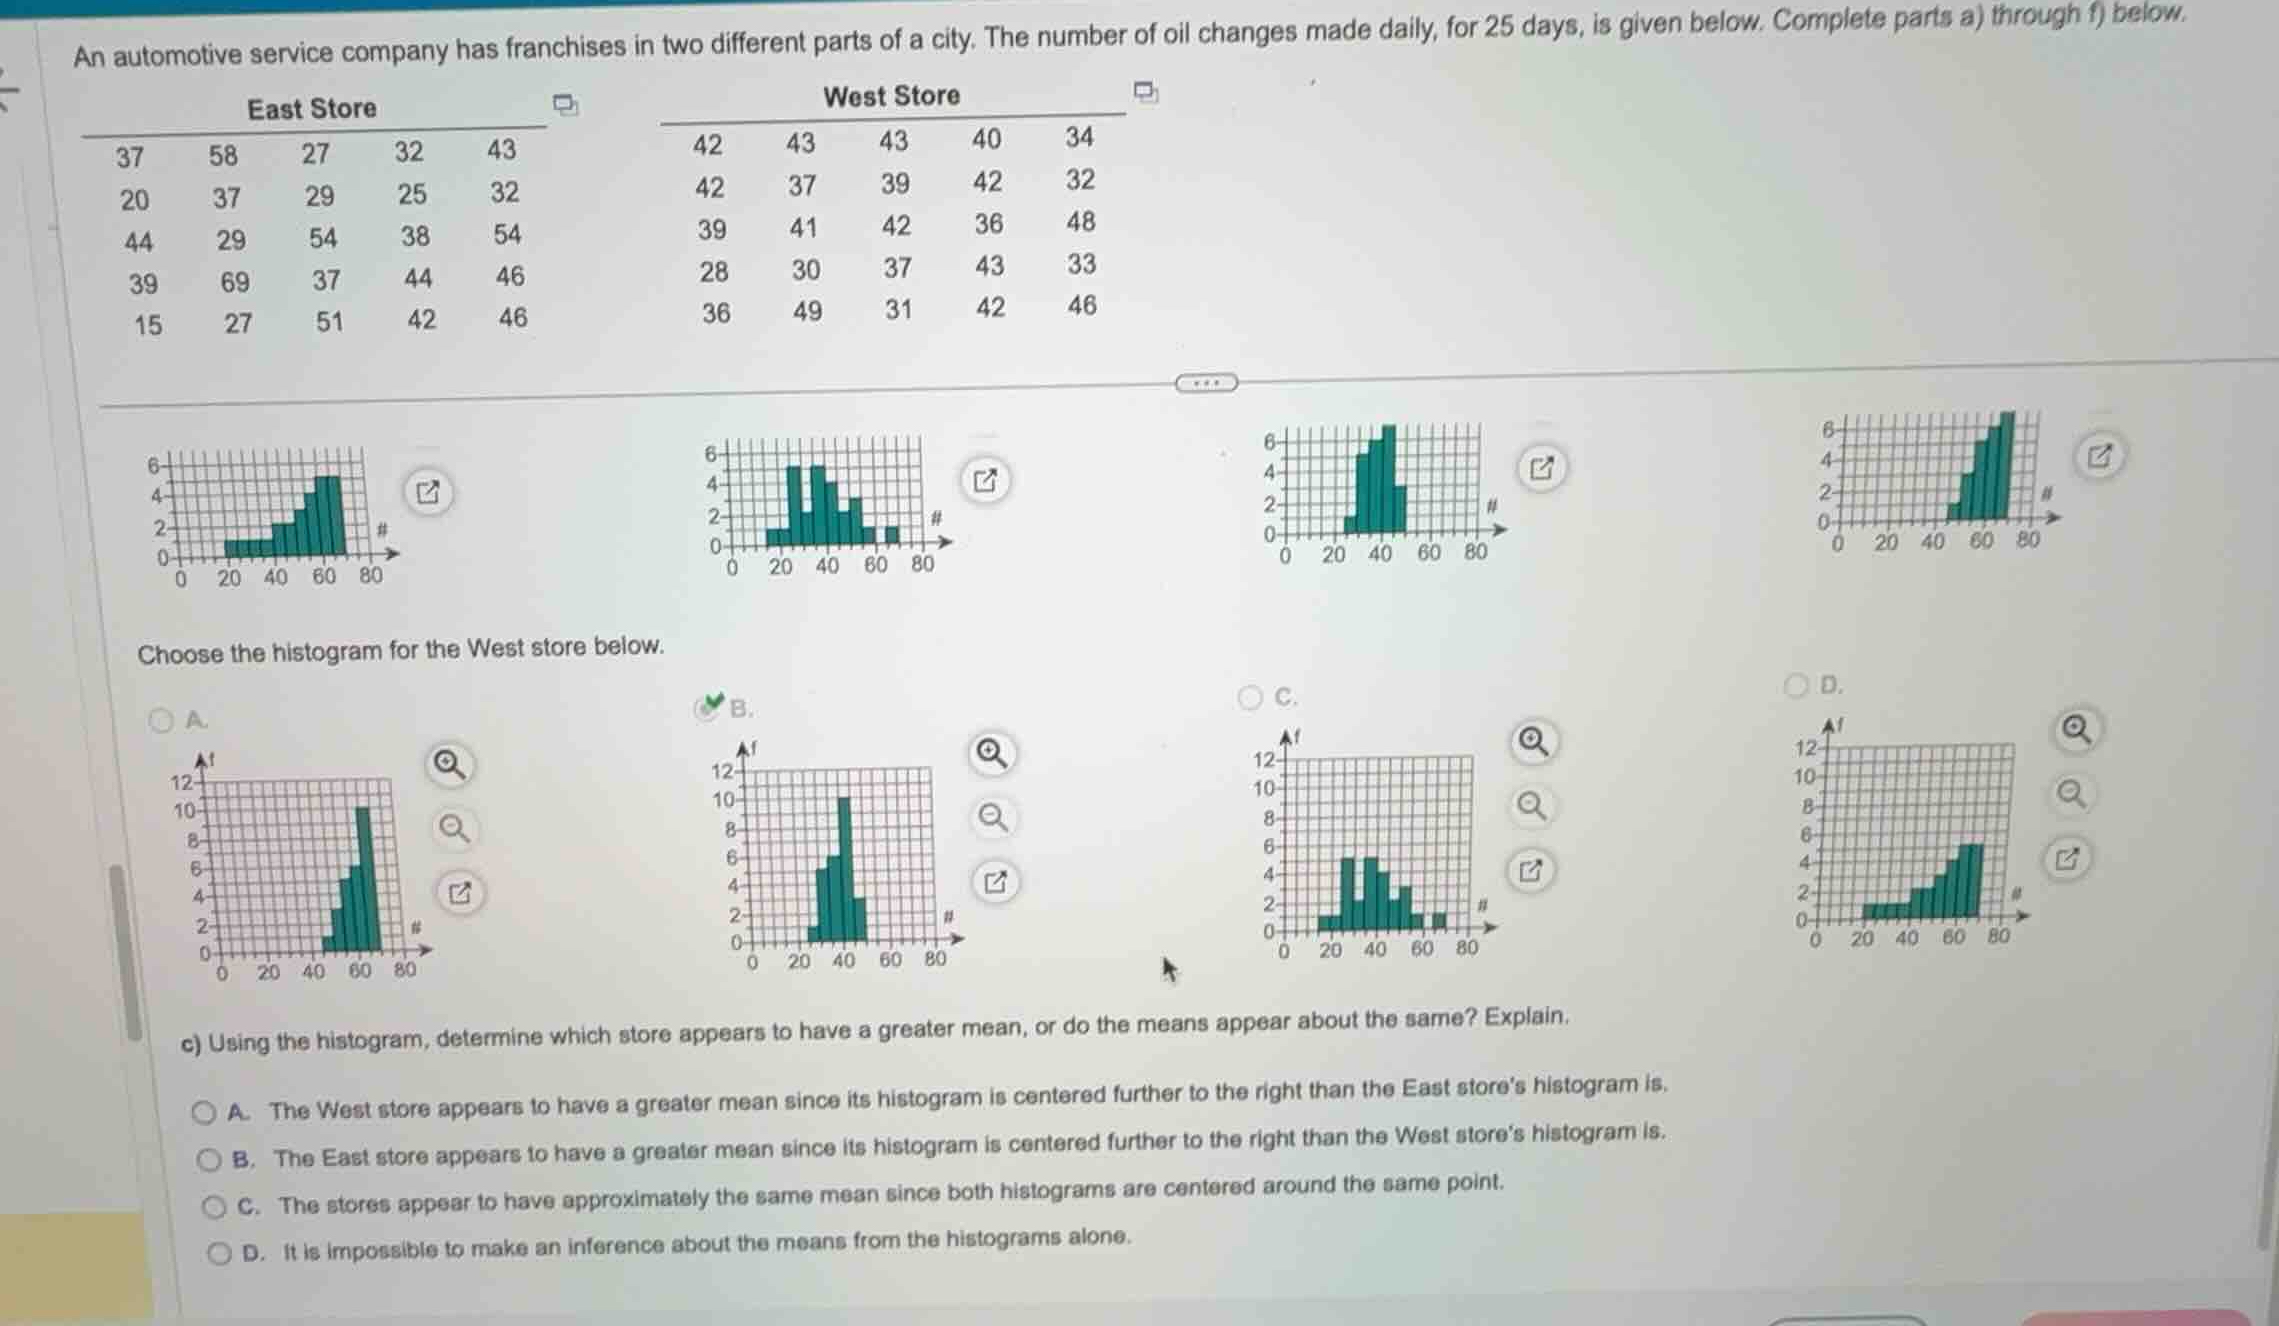
choose the histogram for the west store below.
c) using the histogram, determine which store appears to have a greater mean, or do the means appear about the same? explain.
a. the west store appears to have a greater mean since its histogram is centered further to the right than the east stores histogram is.
b. the east store appears to have a greater mean since its histogram is centered further to the right than the west stores histogram is.
c. the stores appear to have approximately the same mean since both histograms are centered around the same point.
d. it is impossible to make an inference about the means from the histograms alone.
Analyze the West Store data distribution
Using the Histogram Construction knowledge point
Let's count the frequencies of the West Store data in intervals of width 10 starting from 20:
- \(20 \le x < 30\): 28 (1 value)
- \(30 \le x < 40\): 34, 32, 39, 37, 39, 30, 37, 33, 36, 31 (10 values)
- \(40 \le x < 50\): 42, 43, 43, 40, 42, 42, 41, 42, 36 is in the previous class but let's re-verify:
Let's list all 25 values for West Store:
Row 1: 42, 43, 43, 40, 34
Row 2: 42, 37, 39, 42, 32
Row 3: 39, 41, 42, 36, 48
Row 4: 28, 30, 37, 43, 33
Row 5: 36, 49, 31, 42, 46
Let's sort the 25 values:
28, 30, 31, 32, 33, 34, 36, 36, 37, 37, 39, 39, 40, 41, 42, 42, 42, 42, 42, 43, 43, 43, 46, 48, 49
Let's group them into classes of width 10:
- \(20 \le x < 30\): 28 (Frequency = 1)
- \(30 \le x < 40\): 30, 31, 32, 33, 34, 36, 36, 37, 37, 39, 39 (Frequency = 11)
- \(40 \le x < 50\): 40, 41, 42, 42, 42, 42, 42, 43, 43, 43, 46, 48, 49 (Frequency = 13)
Looking at the options for the West Store histogram:
- Option A: Centered around 60 (Frequency peak at 60-70).
- Option B: Centered around 40 (Frequency peak at 40-50 with height 13, and 30-40 with height 11).
- Option C: Centered around 30-40 with lower heights.
- Option D: Centered around 60.
Thus, Option B represents the correct histogram for the West Store.
Compare the means of the two stores
Using the Histogram Interpretation knowledge point
- The East Store histogram (shown in the top-left) is centered further to the right, with its peak and bulk of data in the 50-60 and 60-70 ranges.
- The West Store histogram (Option B) is centered further to the left, with its peak and bulk of data in the 30-40 and 40-50 ranges.
- Since the East Store's distribution is shifted further to the right along the horizontal axis, the East Store appears to have a greater mean.
This corresponds to Option B of part c).

Snap & solve any problem in the app
Get step-by-step solutions on Sovi AI
Photo-based solutions with guided steps
Explore more problems and detailed explanations
Question 1
- (A) Histogram centered around 60
- (B) Histogram centered around 40 (Correct answer)
- (C) Histogram with lower peak centered around 30
- (D) Histogram centered around 60 with gradual rise
Question 2
- (A) The West store appears to have a greater mean since its histogram is centered further to the right than the East store's histogram is.
- (B) The East store appears to have a greater mean since its histogram is centered further to the right than the West store's histogram is. (Correct answer)
- (C) The stores appear to have approximately the same mean since both histograms are centered around the same point.
- (D) It is impossible to make an inference about the means from the histograms alone.