QUESTION IMAGE
Question
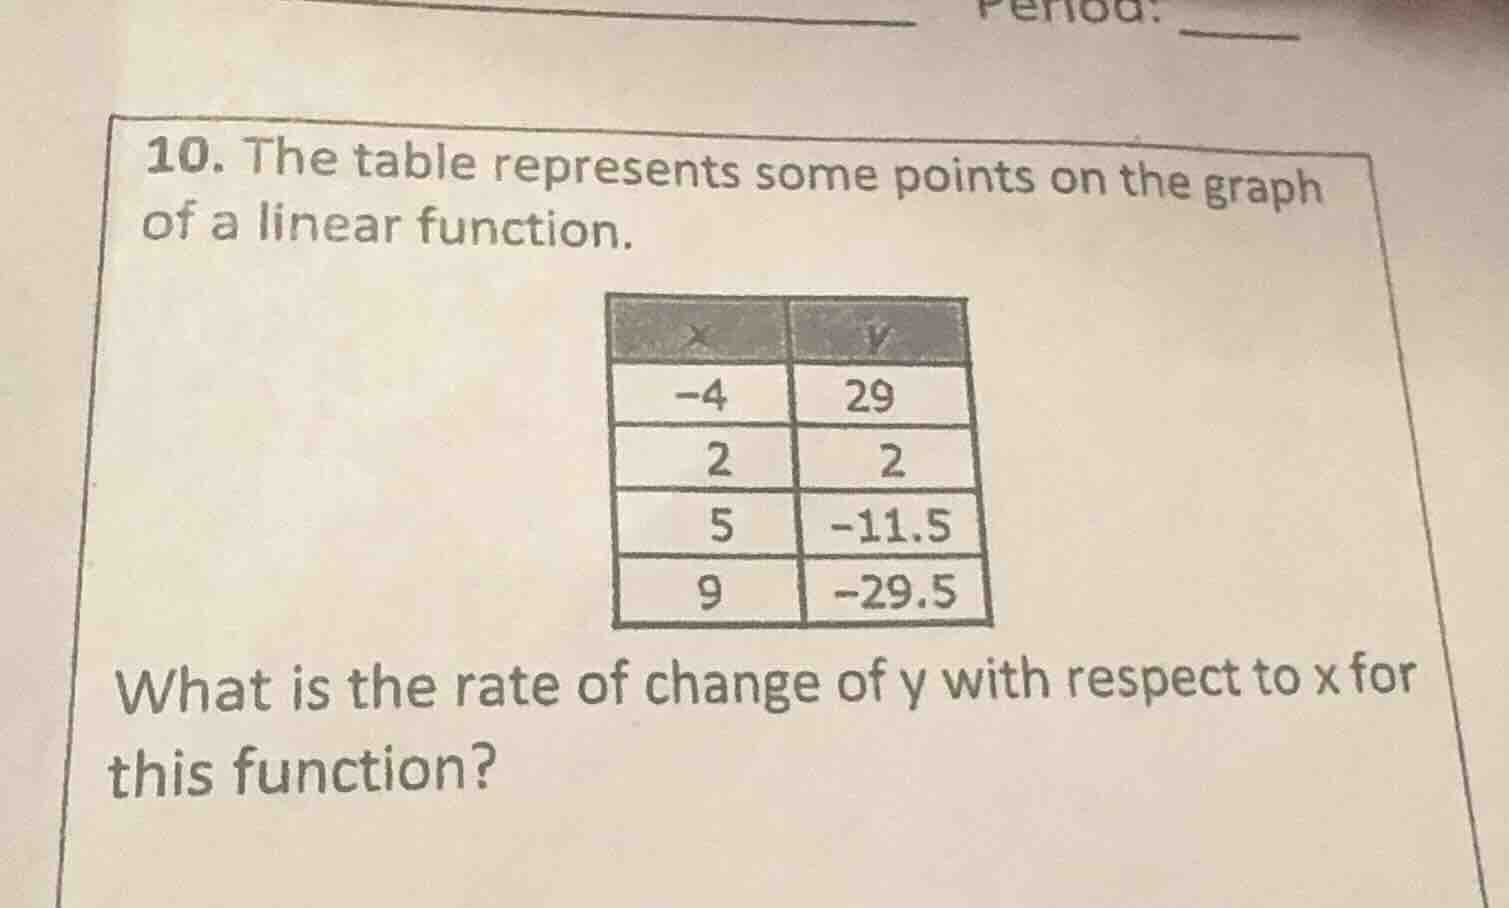
- the table represents some points on the graph of a linear function.
what is the rate of change of y with respect to x for this function?
Step1: Recall the formula for rate of change (slope)
The rate of change of a linear function (slope \( m \)) between two points \((x_1, y_1)\) and \((x_2, y_2)\) is given by \( m=\frac{y_2 - y_1}{x_2 - x_1} \). We can use any two points from the table. Let's choose \((x_1, y_1)=(-4, 29)\) and \((x_2, y_2)=(2, 2)\).
Step2: Substitute the values into the slope formula
Substitute \( x_1=-4 \), \( y_1 = 29 \), \( x_2=2 \), \( y_2 = 2 \) into \( m=\frac{y_2 - y_1}{x_2 - x_1} \).
We can verify with another pair of points, say \((2, 2)\) and \((5, - 11.5)\).
And with \((5, -11.5)\) and \((9, -29.5)\):
All pairs give the same slope, so the rate of change is consistent.

Snap & solve any problem in the app
Get step-by-step solutions on Sovi AI
Photo-based solutions with guided steps
Explore more problems and detailed explanations
\(-4.5\) (or \(-\frac{9}{2}\))