QUESTION IMAGE
Question
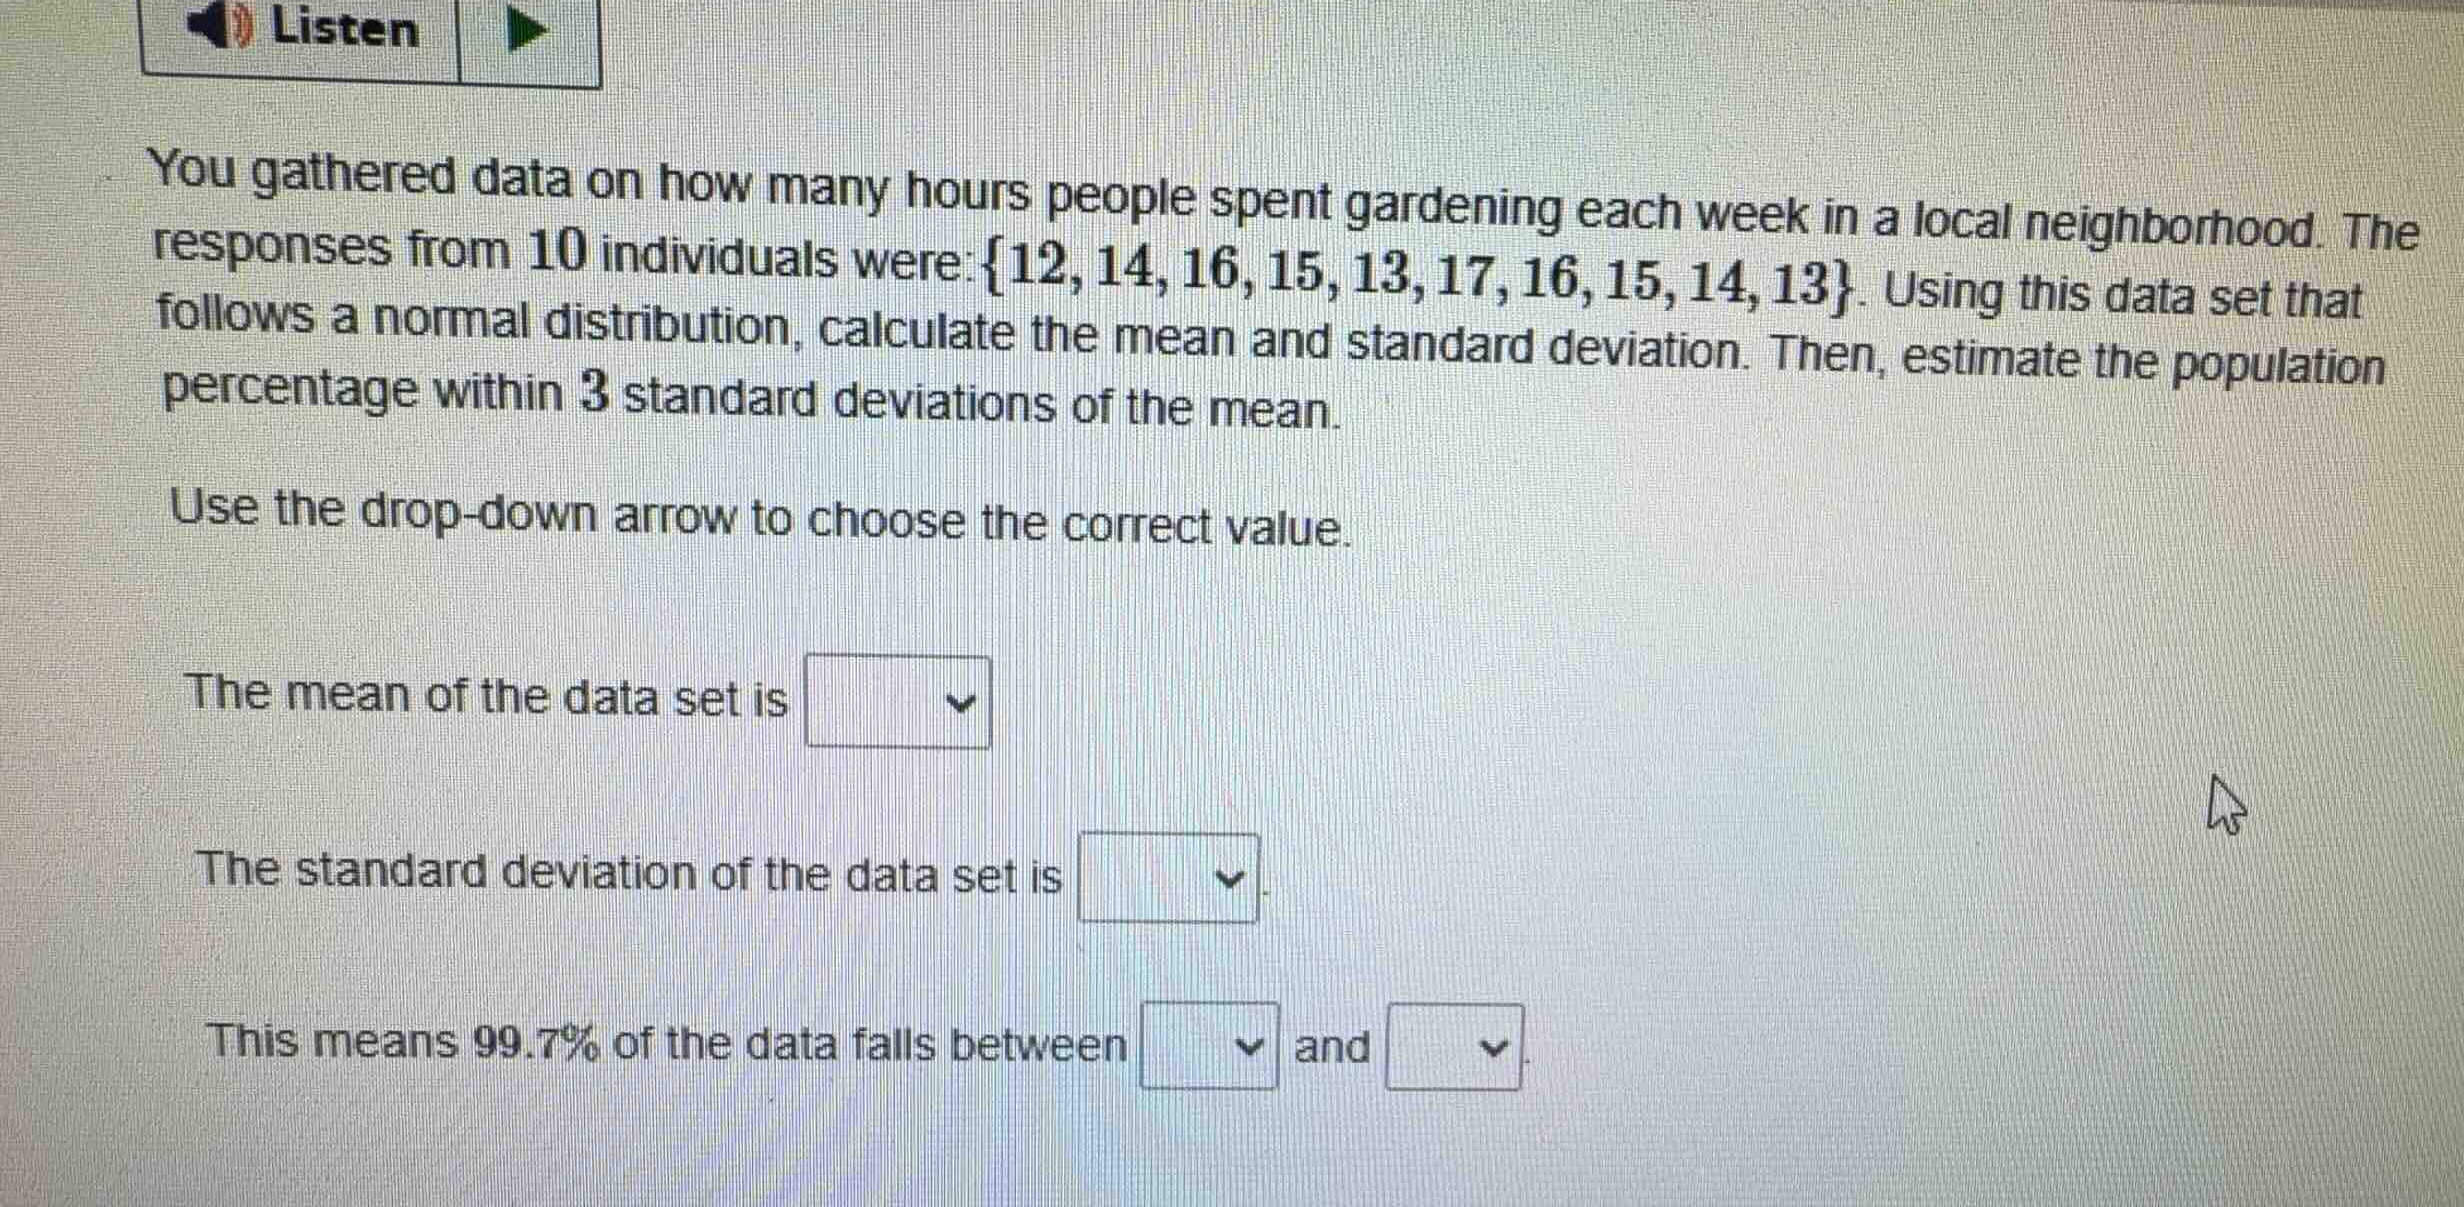
you gathered data on how many hours people spent gardening each week in a local neighborhood. the responses from 10 individuals were: \\{12, 14, 16, 15, 13, 17, 16, 15, 14, 13\\}. using this data set that follows a normal distribution, calculate the mean and standard deviation. then, estimate the population percentage within 3 standard deviations of the mean.
use the drop-down arrow to choose the correct value.
the mean of the data set is dropdown
the standard deviation of the data set is dropdown
this means 99.7% of the data falls between dropdown and dropdown
Calculate the sample mean
Calculate the sample standard deviation
Determine the interval for 3 standard deviations

Snap & solve any problem in the app
Get step-by-step solutions on Sovi AI
Photo-based solutions with guided steps
Explore more problems and detailed explanations
You gathered data on how many hours people spent gardening each week in a local neighborhood. The responses from 10 individuals were: \(\{12, 14, 16, 15, 13, 17, 16, 15, 14, 13\}\). Using this data set that follows a normal distribution, calculate the mean and standard deviation. Then, estimate the population percentage within 3 standard deviations of the mean.
Use the drop-down arrow to choose the correct value.
The mean of the data set is <blank>14.5</blank>
The standard deviation of the data set is <blank>1.58</blank>
This means 99.7% of the data falls between <blank>9.76</blank> and <blank>19.24</blank>