QUESTION IMAGE
Question
which graph shows the solution to the equation \\(4^{x-3} = 8\\)?
Solve the exponential equation algebraically
Using the Solving Exponential Equations Algebraically knowledge point
$$
LATEXBLOCK0
$$
Set up the system of equations for graphical solution
Using the Graphical Solution of Systems knowledge point
$$
LATEXBLOCK1
$$
Analyze the graphs to find the correct system representation
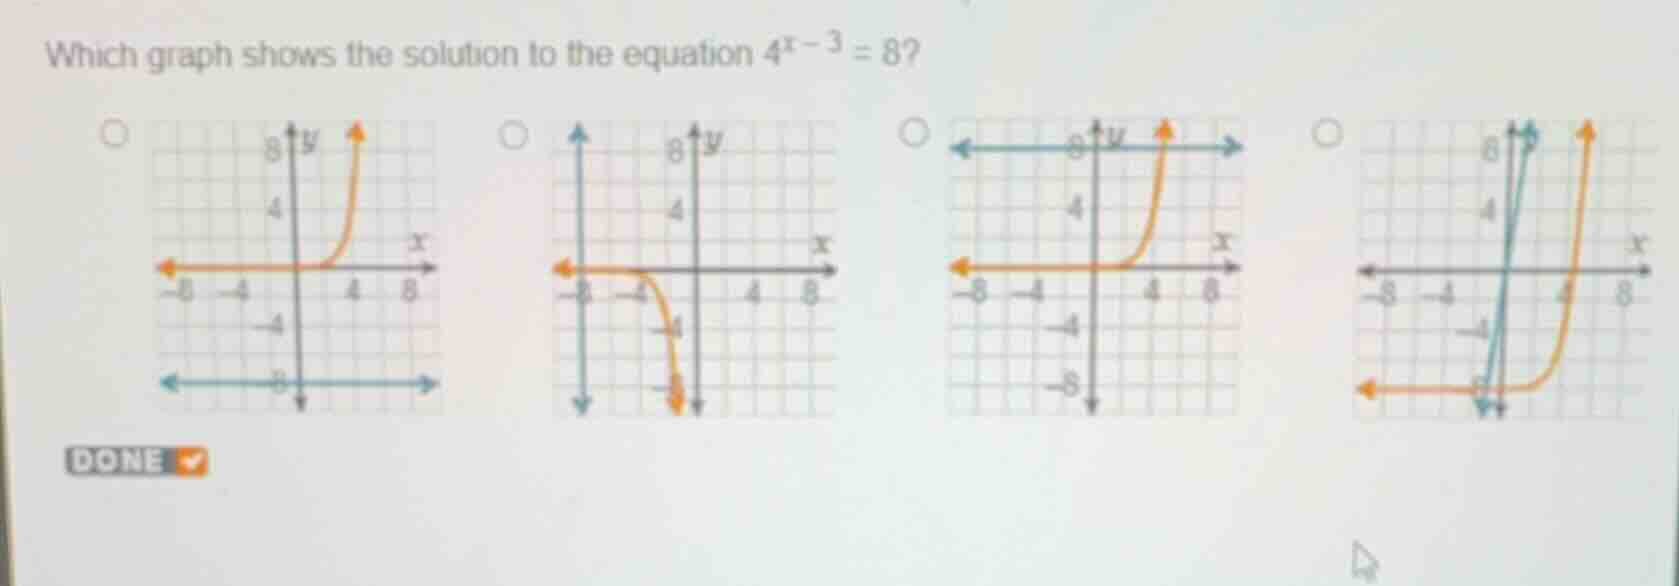
We need to identify the graph that plots the system:
- An exponential growth curve \(y = 4^{x-3}\) with a horizontal asymptote at \(y = 0\).
- A horizontal line \(y = 8\).
- An intersection point at \(x = 4.5, y = 8\).
Looking at the options:
- First graph: Shows the exponential curve \(y = 4^{x-3}\) and a horizontal line at \(y = -8\).
- Second graph: Shows a decreasing curve and a vertical line at \(x = -6\).
- Third graph: Shows the exponential curve \(y = 4^{x-3}\) and a horizontal line at \(y = 8\). The intersection occurs at \(x = 4.5\).
- Fourth graph: Shows the exponential curve and a nearly vertical line.
Therefore, the third graph correctly represents the system.

Snap & solve any problem in the app
Get step-by-step solutions on Sovi AI
Photo-based solutions with guided steps
Explore more problems and detailed explanations
- (A) Graph showing the exponential curve and a horizontal line at \(y = -8\)
- (B) Graph showing a decreasing curve and a vertical line at \(x = -6\)
- (C) Graph showing the exponential curve and a horizontal line at \(y = 8\) (Correct answer)
- (D) Graph showing the exponential curve and a nearly vertical line