QUESTION IMAGE
Question
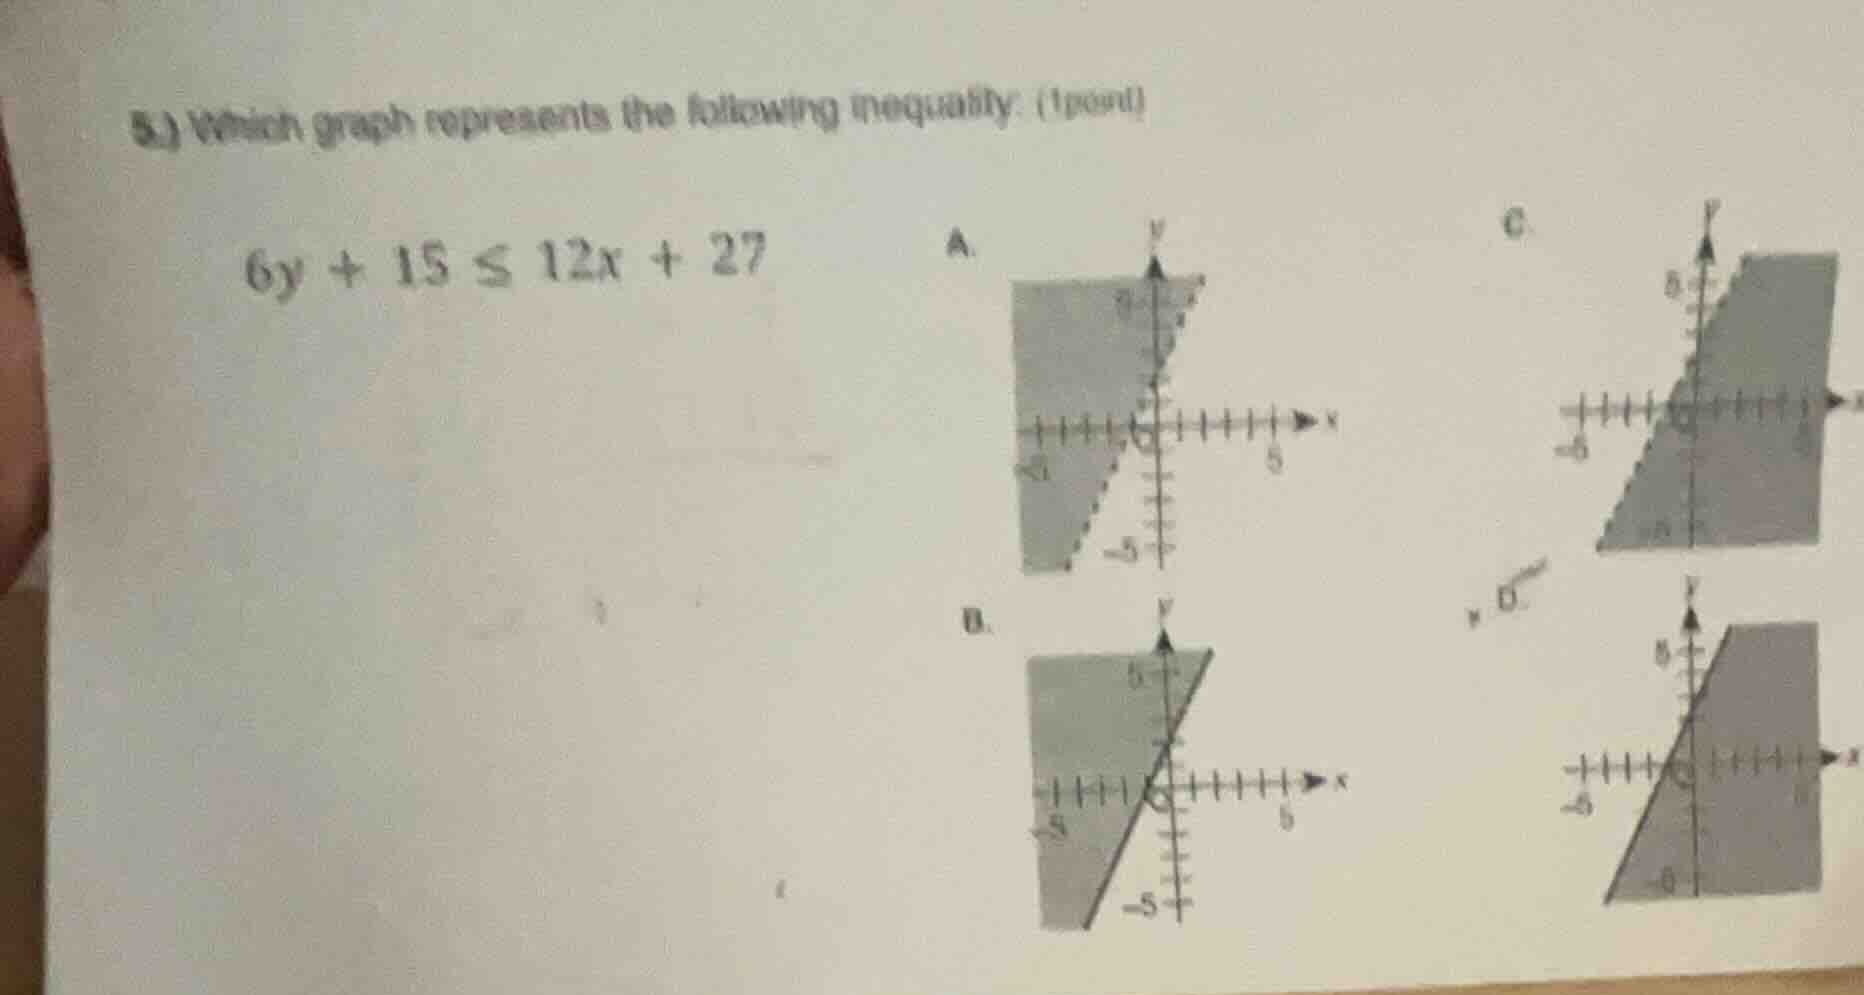
- which graph represents the following inequality. (1 point)
$6y + 15 \leq 12x + 27$
a. graph a
b. graph b
c. graph c
d. graph d
Step1: Simplify the inequality
Subtract 15 from both sides:
$6y \leq 12x + 12$
Step2: Isolate y variable
Divide all terms by 6:
$y \leq 2x + 2$
Step3: Identify line type
Since the inequality is $\leq$, the boundary line is solid (not dashed).
Step4: Test a point for shading
Use $(0,0)$: $0 \leq 2(0)+2$ → $0 \leq 2$, which is true. So shade the region containing $(0,0)$.

Snap & solve any problem in the app
Get step-by-step solutions on Sovi AI
Photo-based solutions with guided steps
Explore more problems and detailed explanations
B. <The graph with a solid line $y=2x+2$ and shading below/left of the line, containing the origin>