QUESTION IMAGE
Question
which graph correctly represents the relationship between arc length and the measure of the corresponding central angle on a circle with radius r?
a.
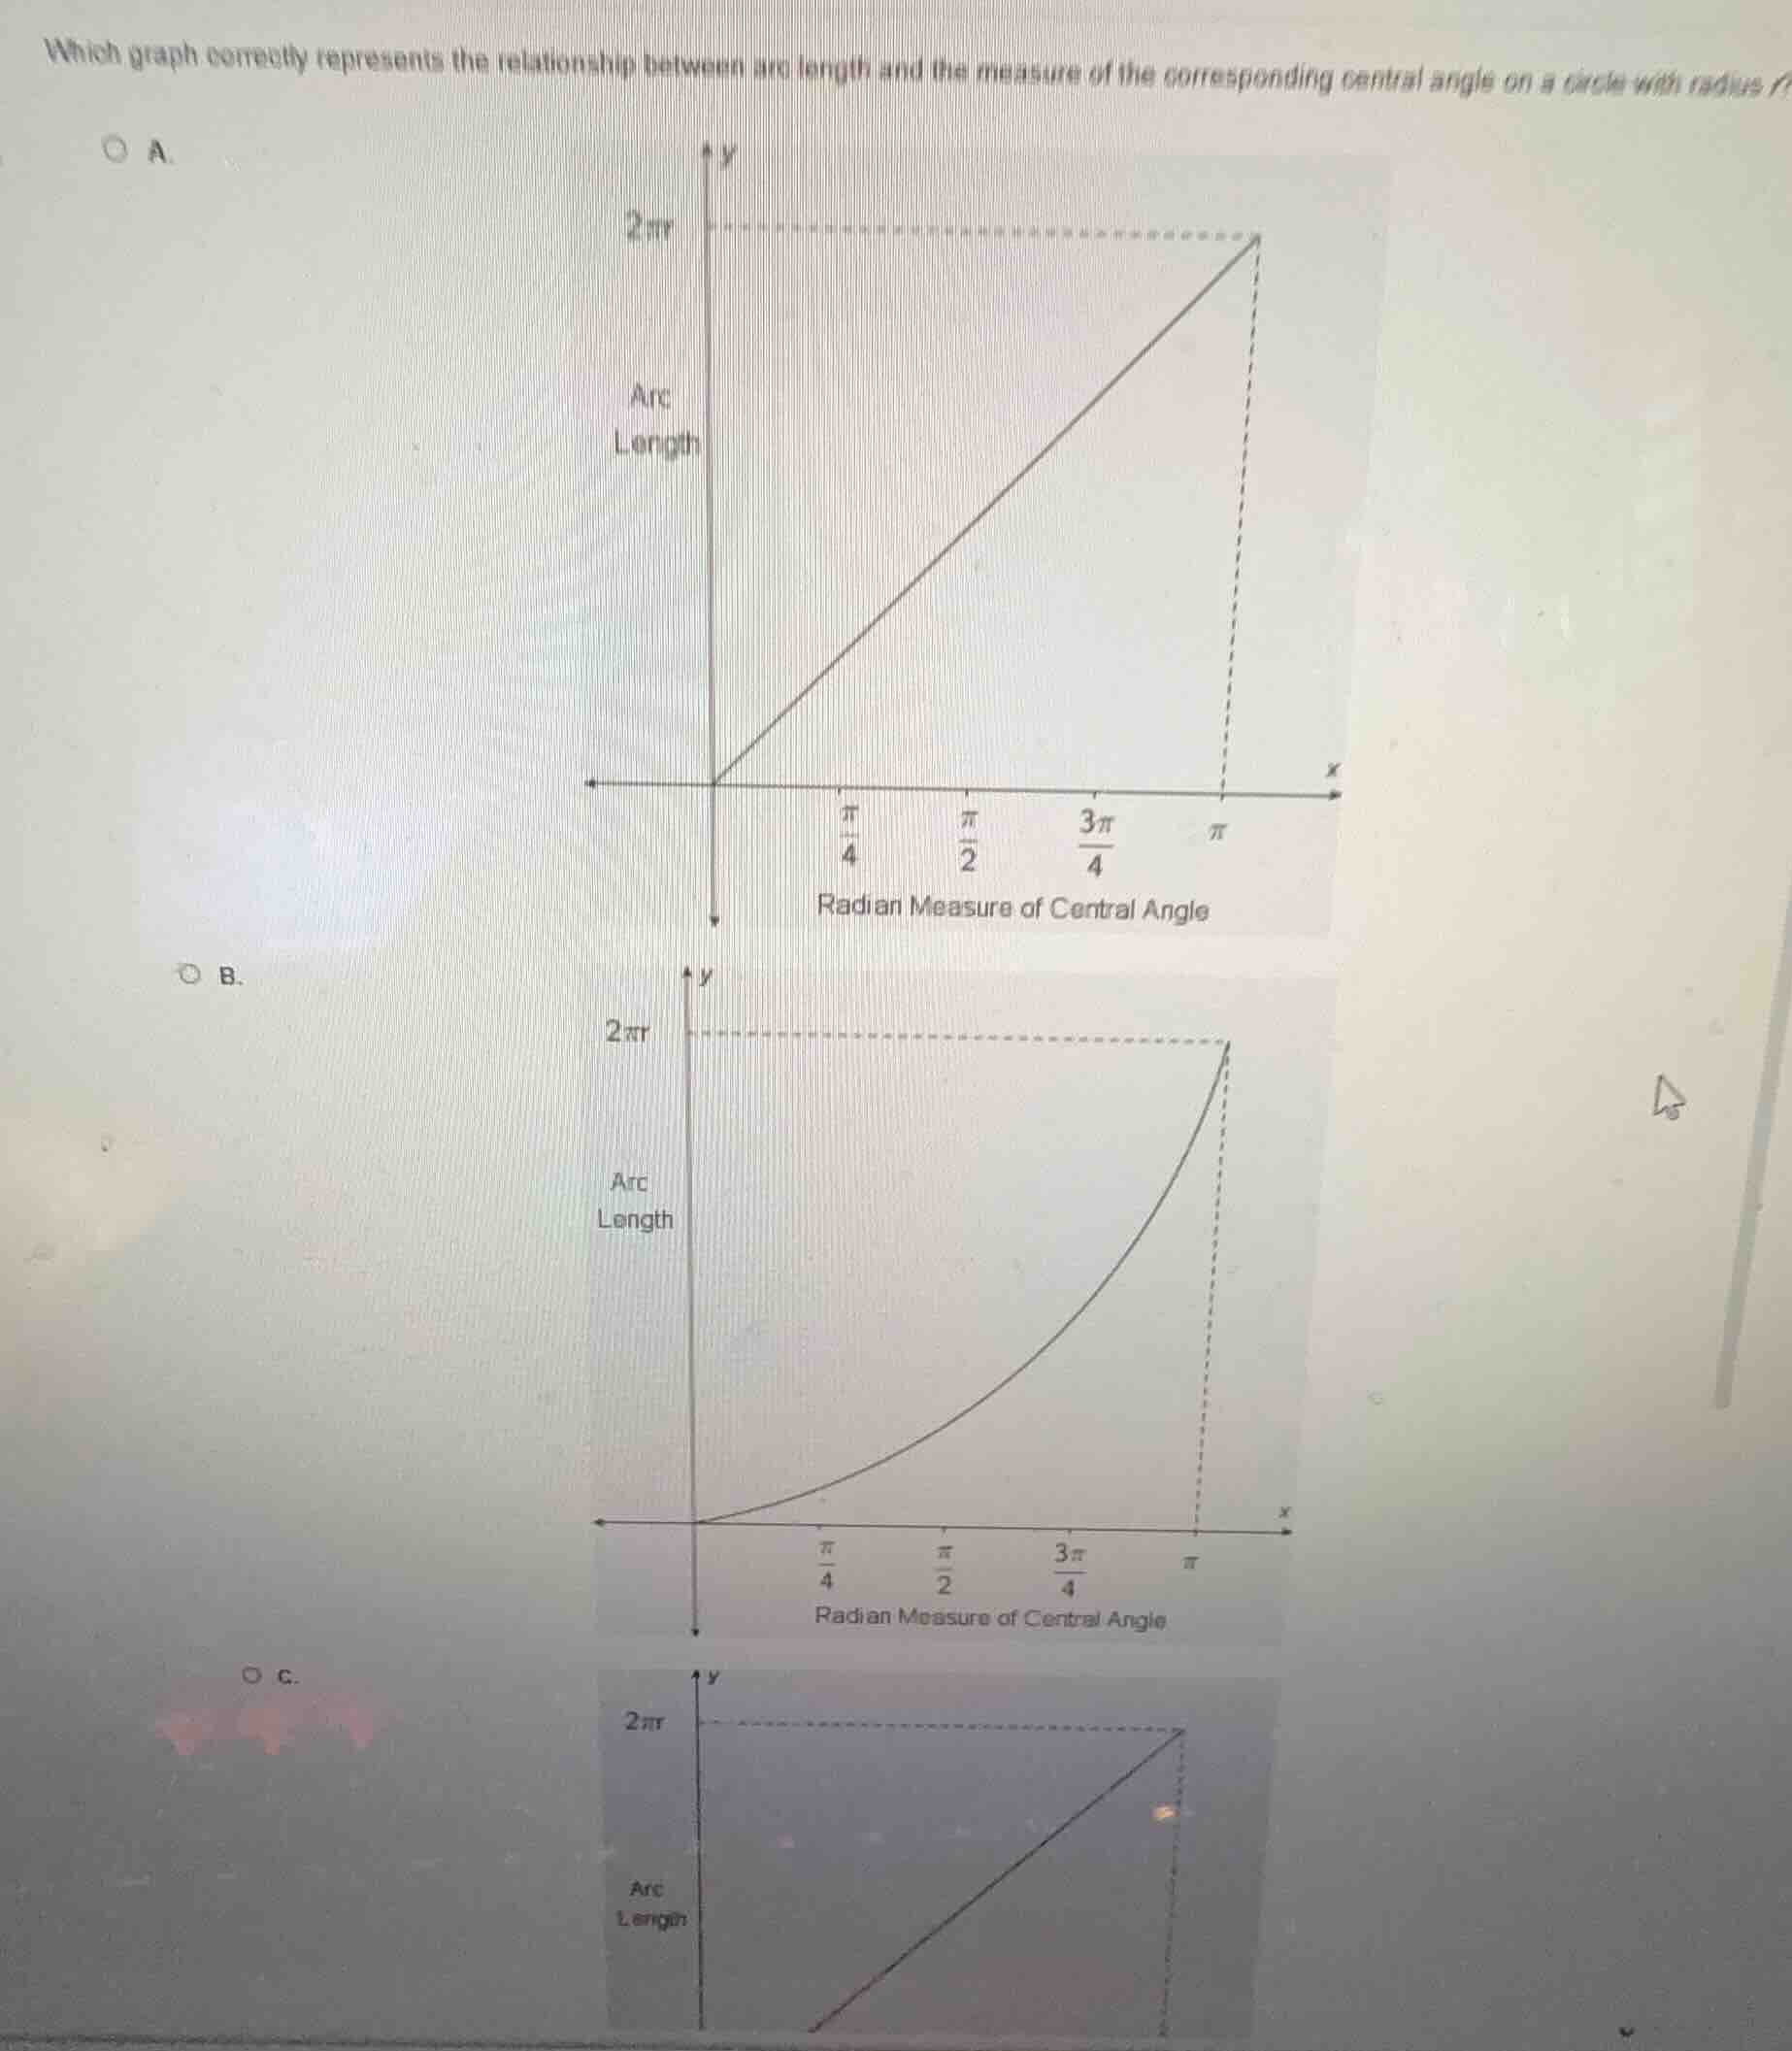
graph a: a line from the origin with x-axis labeled radian measure of central angle (values π/4, π/2, 3π/4, π) and y-axis labeled arc length (value 2πr) at x=π
b.
graph b: a curve starting at the origin, curving upwards, with x-axis labeled radian measure of central angle (values π/4, π/2, 3π/4, π) and y-axis labeled arc length (value 2πr) at x=π
c.
graph c: a line starting from a point on the x-axis left of the origin, going up to (π, 2πr) on the x-axis labeled radian measure of central angle and y-axis labeled arc length
Step1: Recall arc length formula
The formula for arc length $s$ is $s = r\theta$, where $r$ is the circle's radius and $\theta$ is the central angle in radians.
Step2: Identify relationship type
Since $r$ is a constant, $s = r\theta$ is a linear function in the form $y = mx$ (with $m=r$, $y=s$, $x=\theta$), which graphs as a straight line passing through the origin.
Step3: Verify endpoint value
When $\theta = \pi$, $s = r\pi$. The graph in option A shows a straight line where at $\theta=\pi$, the arc length is $2\pi r$? Wait, correction: Wait, full circle is $\theta=2\pi$, $s=2\pi r$. For $\theta=\pi$, $s=\pi r$. But option A's line goes from (0,0) to $(\pi, 2\pi r)$? No, wait, no—wait, no, the formula is $s=r\theta$. If $r$ is fixed, when $\theta=\pi$, $s=r\pi$. But the y-axis top is $2\pi r$, so at $\theta=\pi$, $s=\pi r$ which is half of $2\pi r$, which matches the linear line in A (the line reaches half the y-axis height at $\pi$? Wait no, the graph in A has the line going to $2\pi r$ at $\pi$—wait, no, I misread. Wait no, the correct linear relationship is $s=r\theta$, so it's a proportional linear relationship, passing through (0,0). Option A is a straight line from (0,0) to $(\pi, 2\pi r)$? No, that would be $s=2r\theta$, but no—wait, no, the key is that arc length and central angle (in radians) have a linear, proportional relationship, so the graph must be a straight line through the origin, which is option A. Option B is a curve (non-linear), option C does not start at the origin. So the correct graph is A.

Snap & solve any problem in the app
Get step-by-step solutions on Sovi AI
Photo-based solutions with guided steps
Explore more problems and detailed explanations
A. (The linear graph starting at the origin, reaching $2\pi r$ when the central angle is $\pi$ radians)