QUESTION IMAGE
Question
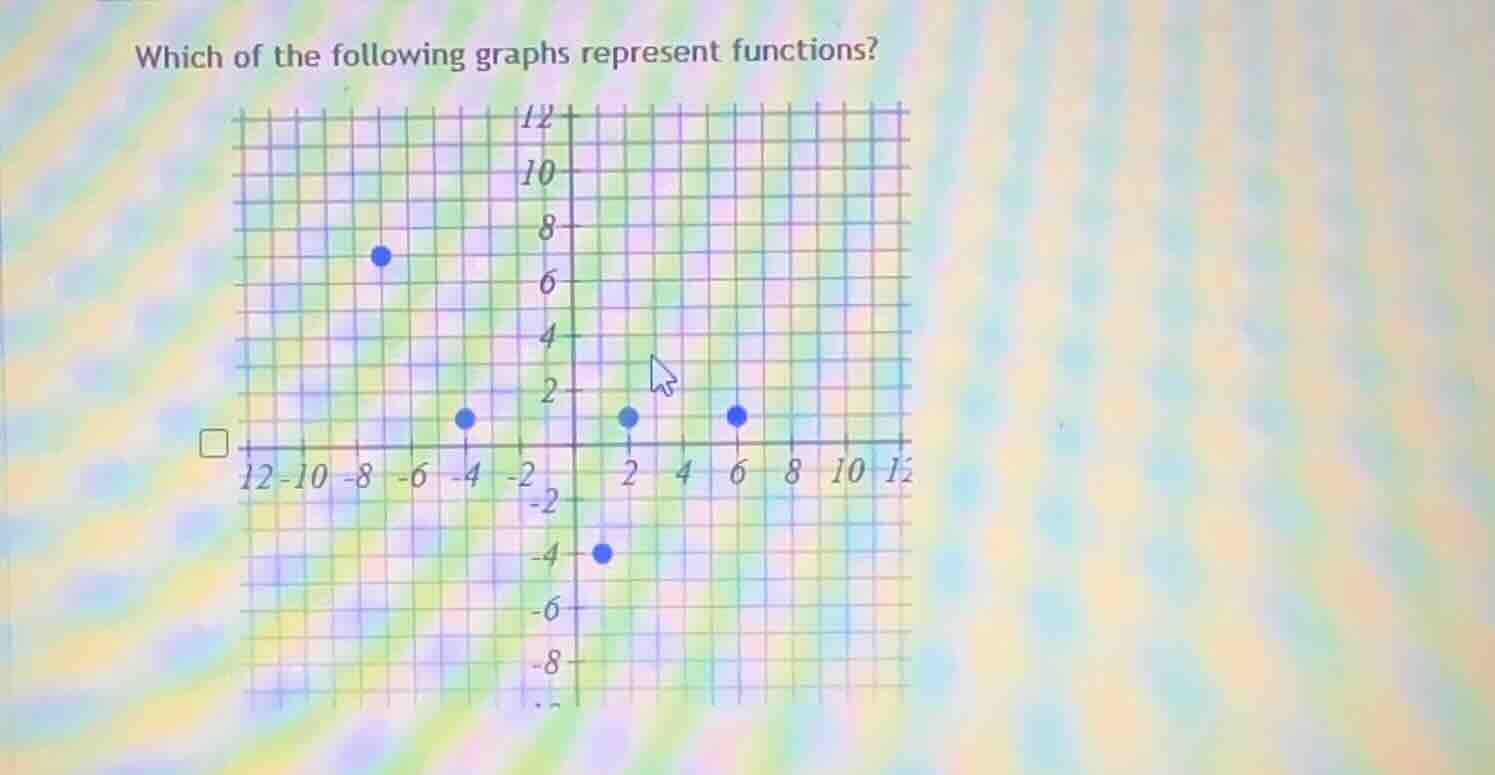
which of the following graphs represent functions? (graph with coordinate grid and blue dots at various points)
Step1: Recall function test rule
Use the Vertical Line Test: A graph represents a function if no vertical line intersects the graph more than once.
Step2: Apply test to given points
Check each x-value:
- $x=-7$ has 1 y-value ($7$)
- $x=-4$ has 1 y-value ($1$)
- $x=0$ has 1 y-value ($-4$)
- $x=2$ has 1 y-value ($1$)
- $x=6$ has 1 y-value ($1$)
No x-value maps to more than one y-value, so the vertical line test passes.

Snap & solve any problem in the app
Get step-by-step solutions on Sovi AI
Photo-based solutions with guided steps
Explore more problems and detailed explanations
This graph represents a function.