QUESTION IMAGE
Question
which of the following is not an example of a chart or graph used in historical research?
bar graph
social pyramid
line graph
circle graph
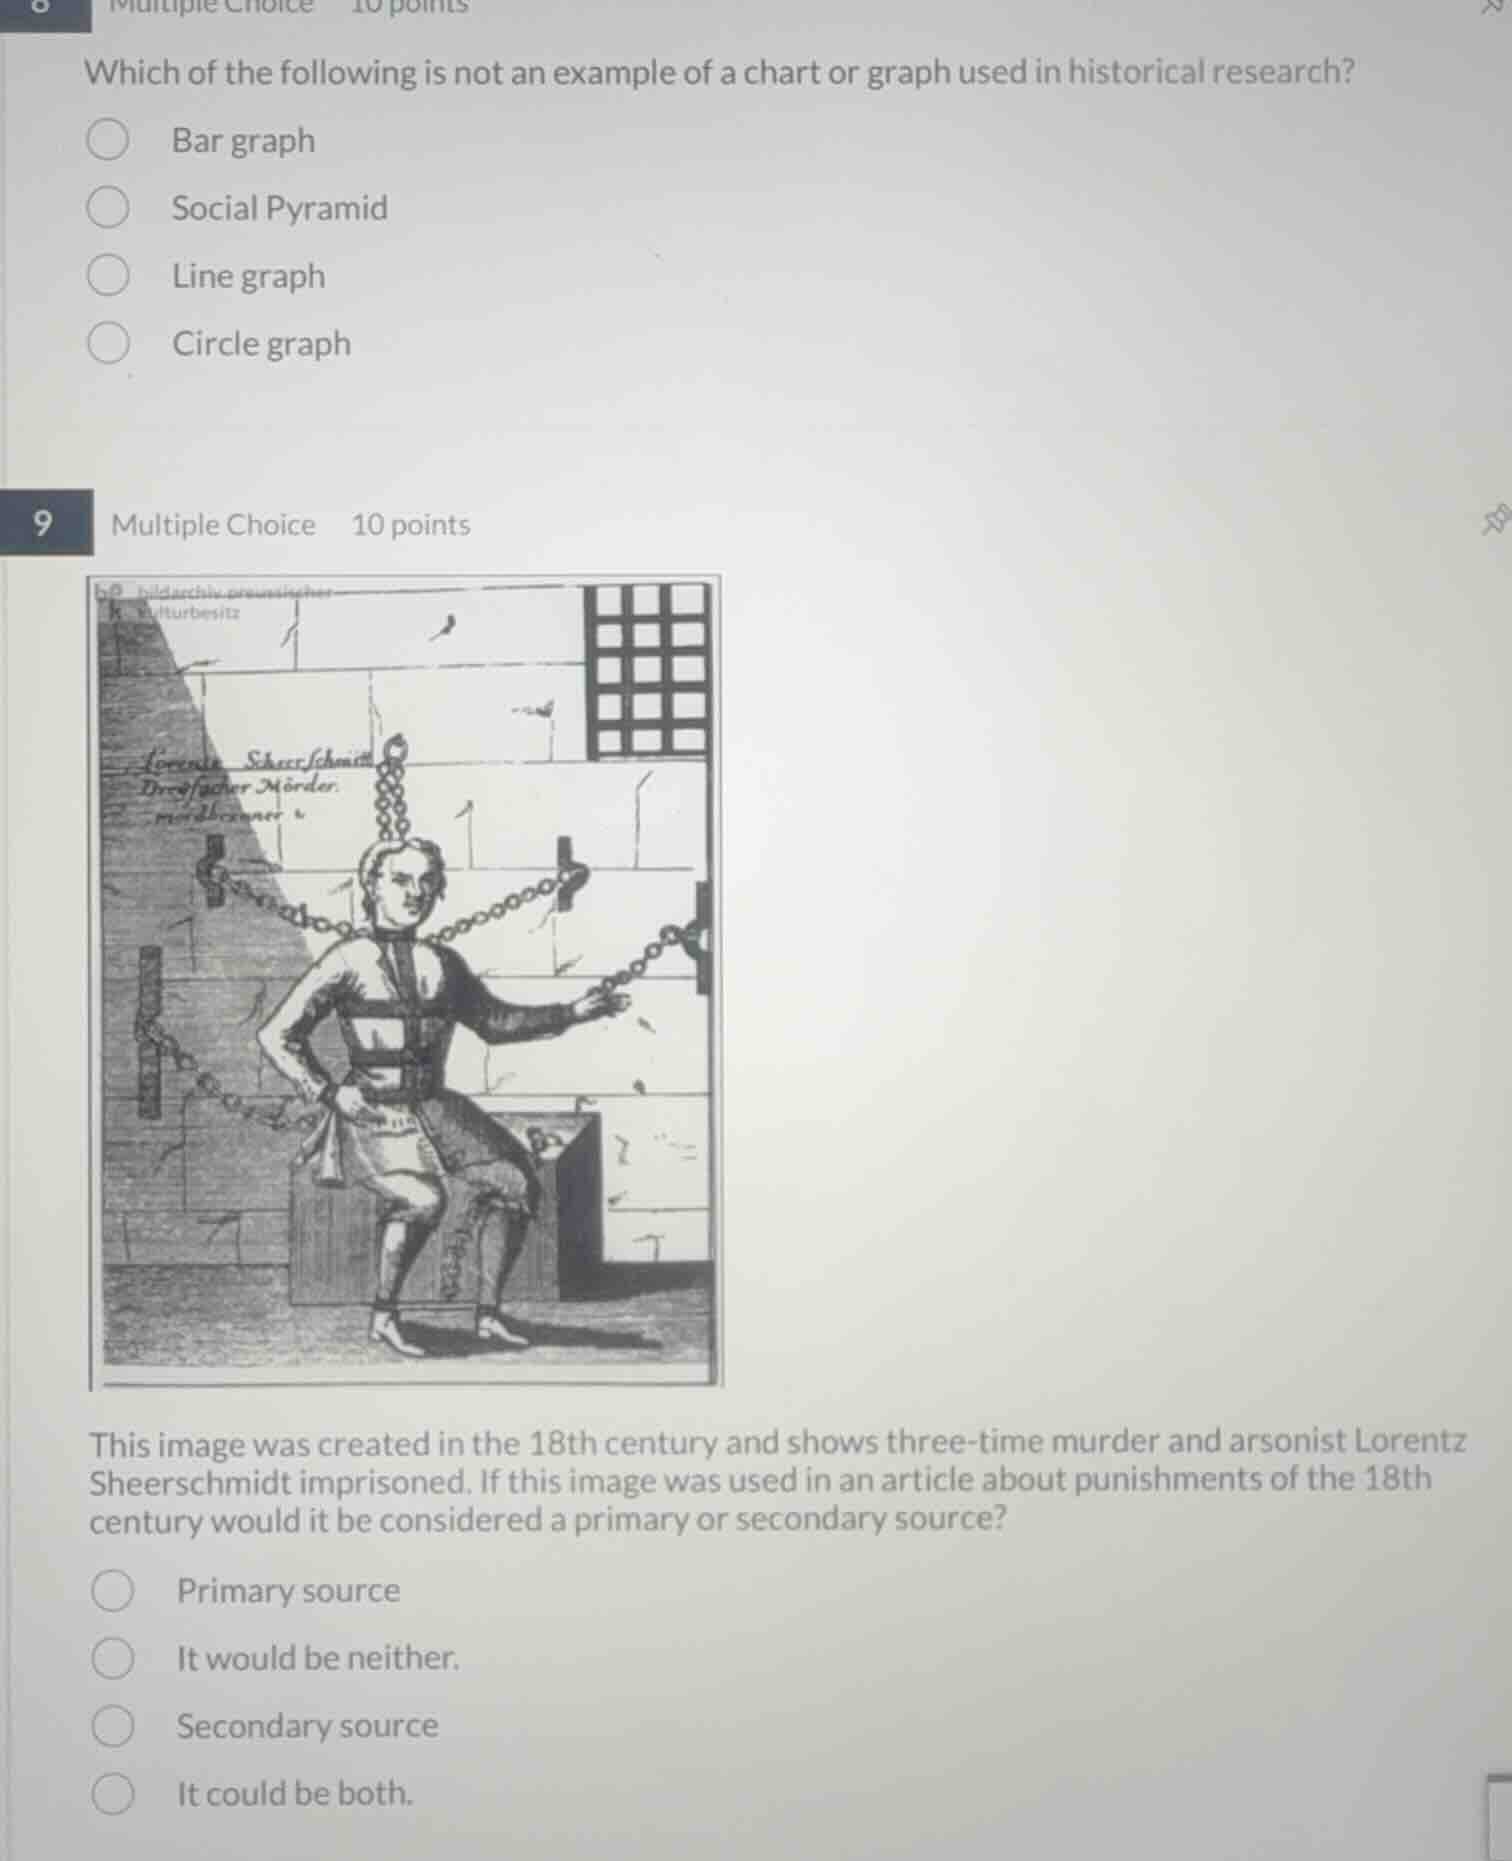
9 multiple choice 10 points
this image was created in the 18th century and shows three-time murder and arsonist lorentz sheerschmidt imprisoned. if this image was used in an article about punishments of the 18th century would it be considered a primary or secondary source?
primary source
it would be neither.
secondary source
it could be both.
<pre_analysis>
{
"quality": "clear",
"question_count": 2,
"skills_matched": [
"direct_cot",
"multiple_choice_formatter",
"explain_then_answer",
"tutor"
],
"needs_drawing": false,
"concepts_used": [
"Primary and Secondary Sources"
],
"new_concepts": [
"Historical Charts and Graphs"
],
"current_concepts": [
"Primary and Secondary Sources",
"Historical Charts and Graphs"
]
}
</pre_analysis>
<reasoning>
Analyze historical charts and graphs
Charts and graphs represent quantitative data visually. Bar graphs, line graphs, and circle (pie) graphs are standard statistical tools used to display numerical data over time or in categories. A social pyramid is a diagram representing social hierarchy rather than a quantitative chart or graph.
Evaluate the 18th-century image source type
Using Primary and Secondary Sources analysis, we determine the nature of the source. The image was created in the 18th century, which is the same time period being studied (18th-century punishments). Because it is a first-hand, contemporary visual record from the era under study, it serves as a primary source.
</reasoning>
<answer>
Question 1
<mcq-option>(A) Bar graph</mcq-option>
<mcq-correct>(B) Social Pyramid</mcq-correct>
<mcq-option>(C) Line graph</mcq-option>
<mcq-option>(D) Circle graph</mcq-option>
Question 2
<mcq-correct>(A) Primary source</mcq-correct>
<mcq-option>(B) It would be neither.</mcq-option>
<mcq-option>(C) Secondary source</mcq-option>
<mcq-option>(D) It could be both.</mcq-option>
</answer>
<post_analysis>
{
"subject": "Social Science",
"question_type": "Multi-part",
"knowledge_point": [
"Social Science",
"History",
"Historical Source Analysis"
]
}
</post_analysis>

Snap & solve any problem in the app
Get step-by-step solutions on Sovi AI
Photo-based solutions with guided steps
Explore more problems and detailed explanations
<pre_analysis>
{
"quality": "clear",
"question_count": 2,
"skills_matched": [
"direct_cot",
"multiple_choice_formatter",
"explain_then_answer",
"tutor"
],
"needs_drawing": false,
"concepts_used": [
"Primary and Secondary Sources"
],
"new_concepts": [
"Historical Charts and Graphs"
],
"current_concepts": [
"Primary and Secondary Sources",
"Historical Charts and Graphs"
]
}
</pre_analysis>
<reasoning>
Analyze historical charts and graphs
Charts and graphs represent quantitative data visually. Bar graphs, line graphs, and circle (pie) graphs are standard statistical tools used to display numerical data over time or in categories. A social pyramid is a diagram representing social hierarchy rather than a quantitative chart or graph.
Evaluate the 18th-century image source type
Using Primary and Secondary Sources analysis, we determine the nature of the source. The image was created in the 18th century, which is the same time period being studied (18th-century punishments). Because it is a first-hand, contemporary visual record from the era under study, it serves as a primary source.
</reasoning>
<answer>
Question 1
<mcq-option>(A) Bar graph</mcq-option>
<mcq-correct>(B) Social Pyramid</mcq-correct>
<mcq-option>(C) Line graph</mcq-option>
<mcq-option>(D) Circle graph</mcq-option>
Question 2
<mcq-correct>(A) Primary source</mcq-correct>
<mcq-option>(B) It would be neither.</mcq-option>
<mcq-option>(C) Secondary source</mcq-option>
<mcq-option>(D) It could be both.</mcq-option>
</answer>
<post_analysis>
{
"subject": "Social Science",
"question_type": "Multi-part",
"knowledge_point": [
"Social Science",
"History",
"Historical Source Analysis"
]
}
</post_analysis>