QUESTION IMAGE
Question
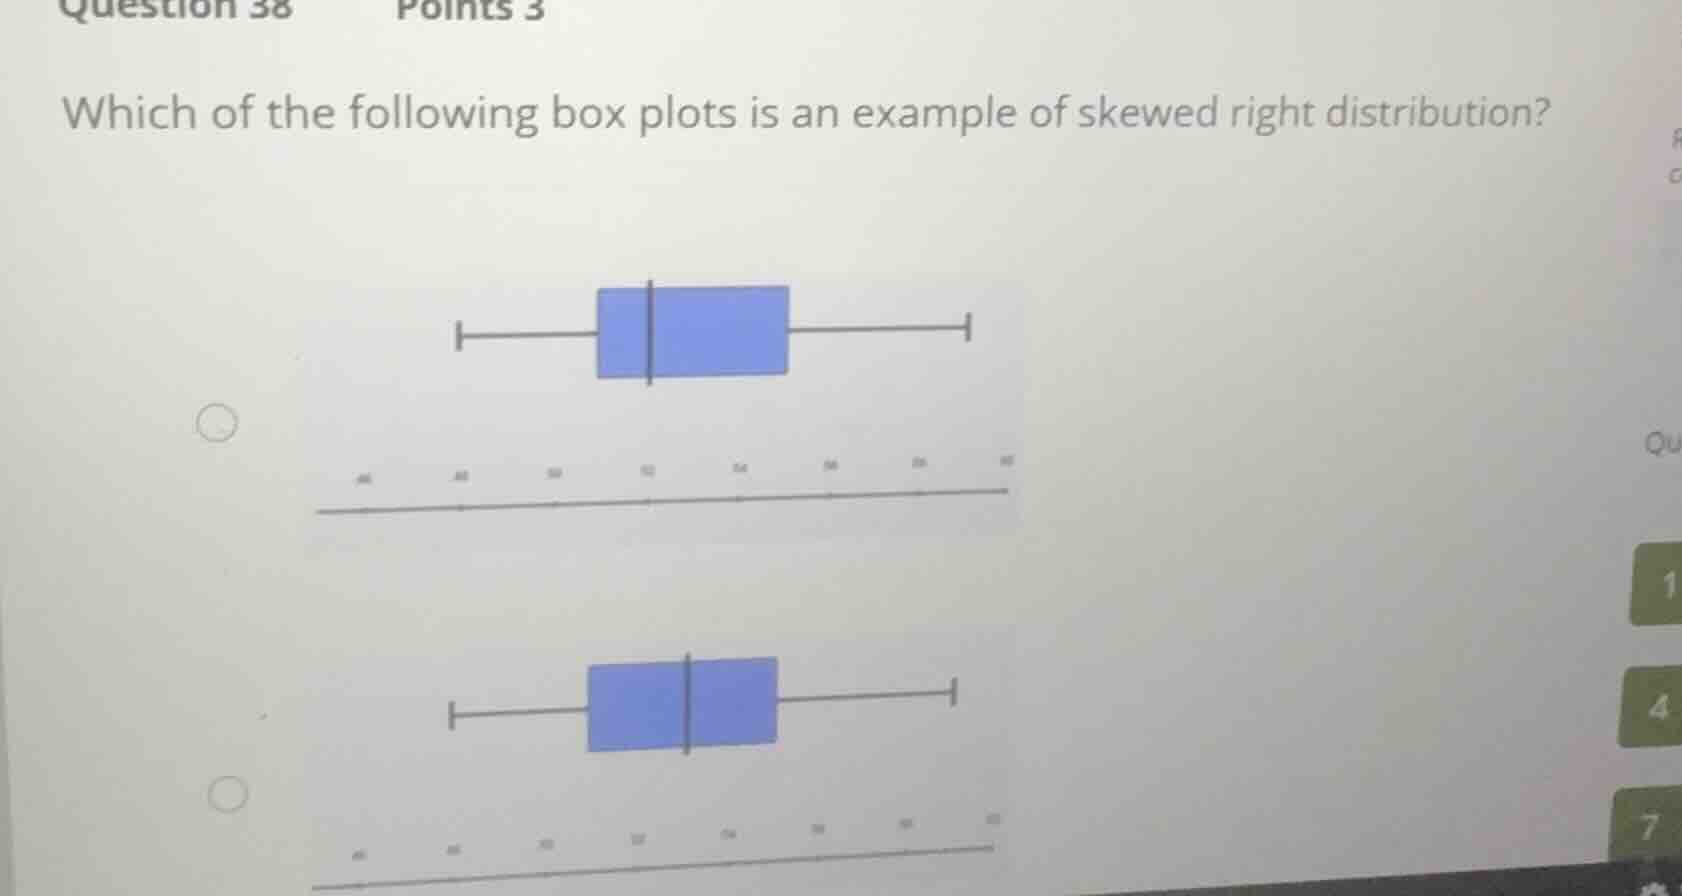
which of the following box plots is an example of skewed right distribution?
Analyze box plot skewness
Using the Data Distribution Shape and Skewness Direction knowledge points
A box plot shows skewness through the relative lengths of its whiskers and the position of the median line within the box:
- Symmetric: The median is centered in the box, and the whiskers are of roughly equal length.
- Skewed Right (Positive Skew): The right whisker is longer than the left whisker, and/or the right side of the box (from median to \(Q_3\)) is wider than the left side (from \(Q_1\) to median).
- Skewed Left (Negative Skew): The left whisker is longer than the right whisker, and/or the left side of the box is wider than the right side.
Evaluate the options
Using the Box Plot Symmetry knowledge point
- First Option:
- The median line is shifted to the left side of the box.
- The right side of the box is noticeably wider than the left side.
- The right whisker is longer than the left whisker.
- This indicates a right-skewed distribution.
- Second Option:
- The median line is located directly in the middle of the box.
- Both whiskers are of equal length.
- This indicates a symmetric distribution.

Snap & solve any problem in the app
Get step-by-step solutions on Sovi AI
Photo-based solutions with guided steps
Explore more problems and detailed explanations
- (A) The first box plot, where the median is shifted to the left and the right whisker is longer. (Correct answer)
- (B) The second box plot, where the median is centered and the whiskers are symmetric.