QUESTION IMAGE
Question
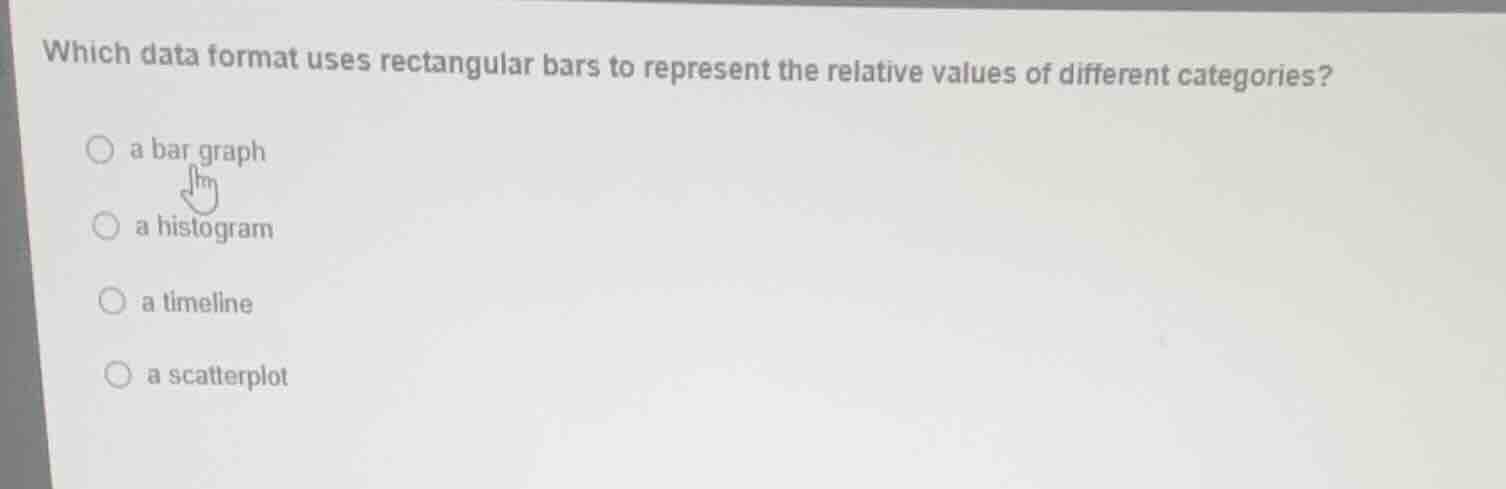
which data format uses rectangular bars to represent the relative values of different categories?
a bar graph
a histogram
a timeline
a scatterplot
Analyze the question requirements
The question asks for a data format that uses rectangular bars to represent the relative values of different categories.
Evaluate the given options
- a bar graph: Uses rectangular bars to compare values across discrete categories.
- a histogram: Uses rectangular bars to represent the frequency distribution of continuous numerical data grouped into ranges (bins), rather than discrete categories.
- a timeline: Represents events in chronological order along a line.
- a scatterplot: Uses individual data points plotted on a coordinate grid to show relationships between two numerical variables.
Select the correct option
A bar graph is specifically designed to represent and compare the relative values of distinct, discrete categories using rectangular bars.

Snap & solve any problem in the app
Get step-by-step solutions on Sovi AI
Photo-based solutions with guided steps
Explore more problems and detailed explanations
- (A) a bar graph (Correct answer)
- (B) a histogram
- (C) a timeline
- (D) a scatterplot