QUESTION IMAGE
Question
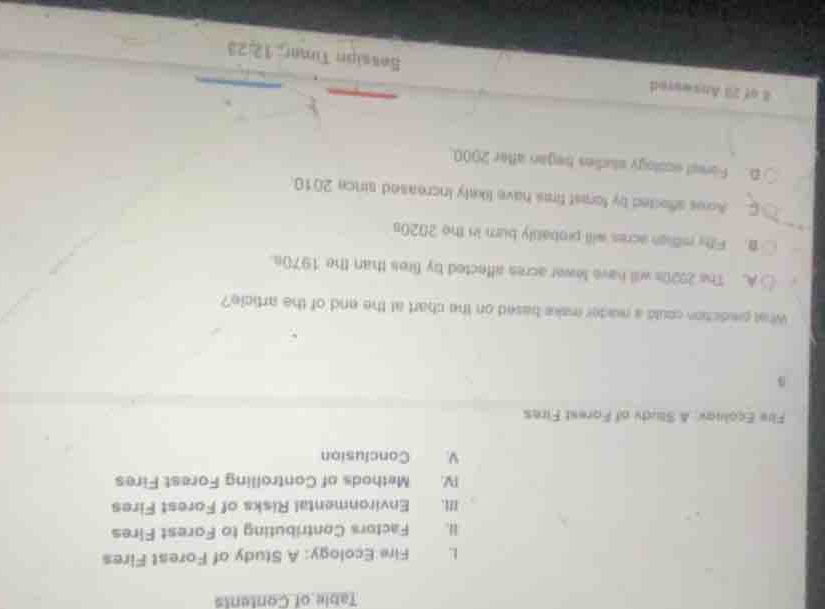
what prediction could a reader make based on the chart at the end of the article?
a. the 2020s will have fewer acres affected by fires than the 1970s.
b. fifty million acres will probably burn in the 2020s.
c. acres affected by forest fires have likely increased since 2010.
d. forest ecology studies began after 2000.
Analyze the question and options
The image is oriented upside down. Let's read the text carefully by rotating it mentally:
- Title/Header: "Fire Ecology: A Study of Forest Fires"
- Section below: "Table of Contents"
- I. Fire Ecology: A Study of Forest Fires
- II. Factors Contributing to Forest Fires
- III. Environmental Risks of Forest Fires
- IV. Methods of Controlling Forest Fires
- V. Conclusion
- Question 5: "What prediction could a reader make based on the chart at the end of the article?"
- Options:
- (A) The 2020s will have fewer acres affected by fires than the 1970s.
- (B) Fifty million acres will probably burn in the 2020s.
- (C) Acres affected by forest fires have likely increased since 2010.
- (D) Forest ecology studies began after 2000.
Evaluate the options using synthesis of information
Using the Synthesis of Information and Text and Data Integration knowledge points:
- The question asks for a prediction based on a "chart at the end of the article" (which is not fully pictured, but we can evaluate the logical validity of the predictive statements).
- Option (C) states: "Acres affected by forest fires have likely increased since 2010." This is a standard, reasonable trend-based prediction/extrapolation often found in environmental data charts showing rising global temperatures and fire frequencies in recent decades.
- Let's look at the student's query from the memory summary: they are questioning why a narrower option like (A) is not the best choice.
- Option (A) predicts that the 2020s will have fewer acres affected than the 1970s. Historically and ecologically, forest fire acreage has significantly increased since the 1970s due to climate factors and fuel accumulation. Therefore, predicting a decrease (fewer acres) contradicts general ecological trends and what such a chart would show.
- Option (C) represents a highly probable upward trend consistent with modern environmental data on forest fires.
Formulate the explanation
- Explain the general trend of forest fire data (typically showing an increase in acreage burned over recent decades).
- Address why Option (C) is the correct prediction based on typical environmental data trends.
- Explain why Option (A) is incorrect (it predicts a decrease compared to the 1970s, which contradicts the historical upward trend of wildfire activity).

Snap & solve any problem in the app
Get step-by-step solutions on Sovi AI
Photo-based solutions with guided steps
Explore more problems and detailed explanations
- (A) The 2020s will have fewer acres affected by fires than the 1970s.
- (B) Fifty million acres will probably burn in the 2020s.
- (C) Acres affected by forest fires have likely increased since 2010. (Correct answer)
- (D) Forest ecology studies began after 2000.